2018年全球粗钢产量增长4.6%
2019年1月25日 比利时布鲁塞尔
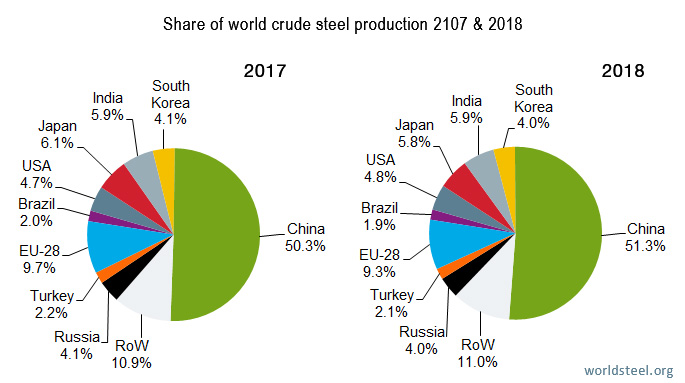
2018年全球粗钢产量达到18.086亿吨,同比增长 4.6%。除欧盟同比收缩0.3%外,2018年所有地区的粗钢产量都有所增长。
2018年亚洲全年粗钢产量达到12.711亿吨,同比增长5.6%。其中,中国的粗钢产量为9.283亿吨,同比增长6.6%。中国粗钢产量占全球粗钢产量的份额,由2017年50.3%上升到2018年的51.3%。印度2018年的粗钢产量为1.065亿吨,同比增长4.9%,同时意味着印度已经超过日本成为世界第二大钢铁生产国。日本2018年的粗钢产量为1.043亿吨,同比下降0.3%。韩国2018年的粗钢产量为7250万吨,同比增长2.0%。
2018年,欧盟地区的粗钢产量为1.681亿吨,同比下降0.3%。其中,德国*的粗钢产量为4240万吨,同比下降2.0%。意大利的粗钢产量为2450万吨,同比增长1.7%。法国的粗钢产量为1540万吨,同比下降0.7%。西班牙的粗钢产量为1430万,同比下降0.1%。
北美洲2018年的粗钢产量为1.205亿吨,同比增长4.1%。其中美国的粗钢产量为8670万吨,同比增长6.2%。
2018年独联体国家的粗钢产量为1.013亿吨,同比增长0.3%。其中,俄罗斯*的粗钢产量为7170万吨,同比增长0.3%。乌克兰的粗钢产量为2110万吨,同比下降1.1%。
2018年南美国家的粗钢产量为4430万吨,同比增长1.3%。其中巴西的粗钢产量为3470万吨,同比增长1.1%。
2018年中东地区的粗钢产量为3850万吨,同比增长11.7%。其中伊朗*的粗钢产量为2500万吨,同比增长17.7%。
2018年土耳其的粗钢产量为3730万吨,同比下降0.6%。
| Top 10 steel-producing countries | ||||
| Rank | Country | 2018 (Mt) | 2017 (Mt) | %2018/2017 |
| 1 | China | 928.3 | 870.9 | 6.6 |
| 2 | India | 106.5 | 101.5 | 4.9 |
| 3 | Japan | 104.3 | 104.7 | -0.3 |
| 4 | United States | 86.7 | 81.6 | 6.2 |
| 5 | South Korea | 72.5 | 71.0 | 2.0 |
| 6 | Russia (e) | 71.7 | 71.5 | 0.3 |
| 7 | Germany (e) | 42.4 | 43.3 | -2.0 |
| 8 | Turkey | 37.3 | 37.5 | -0.6 |
| 9 | Brazil | 34.7 | 34.4 | 1.1 |
| 10 | Iran (e) | 25.0 | 21.2 | 17.7 |
编者按:
- 世界钢铁协会是世界上规模最大、活跃度最高的行业协会之一,代表了大约160家钢铁生产企业(其中包括世界上10家最大型钢铁企业其中的9家),以及各国和各地区的钢铁行业协会和钢铁研究机构,会员企业粗钢产量占世界粗钢产量的大约85%。
- 本新闻稿中发布的2018年产量数据为初步统计结果,可能会有所变化。
- *德国、俄罗斯和伊朗12月的粗钢产量数据还未经确认,上述粗钢总产量数据仅为预估。
- 由于反垄断合规指南,世界钢铁协会不再提供粗钢的月产能利用率。获取更多信息请登陆经济合作与发展组织(OECD)网站查询。
- 中国钢铁工业协会最近更新了2017年的中国粗钢产量,从8.317亿吨更改为8.709亿吨。
- 官网提供的月度统计数据显示64个纳入世界钢铁协会统计产钢国的粗钢产量数据,可通过这里查阅。
各国产量同比数据
2018年全球粗钢总产量数据 (pdf | 30.51 KB) 2018年12月纳入世界钢铁协会统计的64个产钢国的产量数据 (pdf | 231.09 KB) 关于世界钢铁协会的统计数据(常见问题)
媒体联系人

布拉德利.福德
交流事务主管
+32 2 702 8898
+32 478 32 96 70