
可持续发展
指标报告
2025年版
钢铁行业的可持续发展绩效
引言
随着气候变化、生物多样性丧失、环境污染以及人们对更具包容性和韧性经济的需求的日益增长,世界面临的挑战也在不断升级。因此可持续发展不仅仅是一个愿景,已经发展成为塑造我们生活、工作和未来建设的必然要求。
作为现代社会发展的基石,钢铁行业深知其在推动可持续发展进程中肩负的重要使命。从连接社群的基础设施建设,到推动低碳经济发展的创新成果,钢铁始终是转型发展的核心支柱,钢铁行业肩负着引领变革的重要责任。
在联合国可持续发展目标和《巴黎协定》等全球框架的指引下,这份《可持续发展指标报告2025年版》再次重申了钢铁行业长期以来对透明度、问责制和持续改进的坚定承诺。报告展示了钢铁行业如何在关键议题领域持续开展衡量、管理和提升工作,彰显了我们满足社会不断变化的期望,为可持续发展的未来做出有意义的贡献。
我们将继续携手共同开辟一条通往更可持续、更具韧性且更包容的钢铁行业之路,它不仅能满足当下的需求,更能守护未来的无限可能。
2025年主要可持续发展项目
可持续发展指标
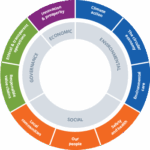
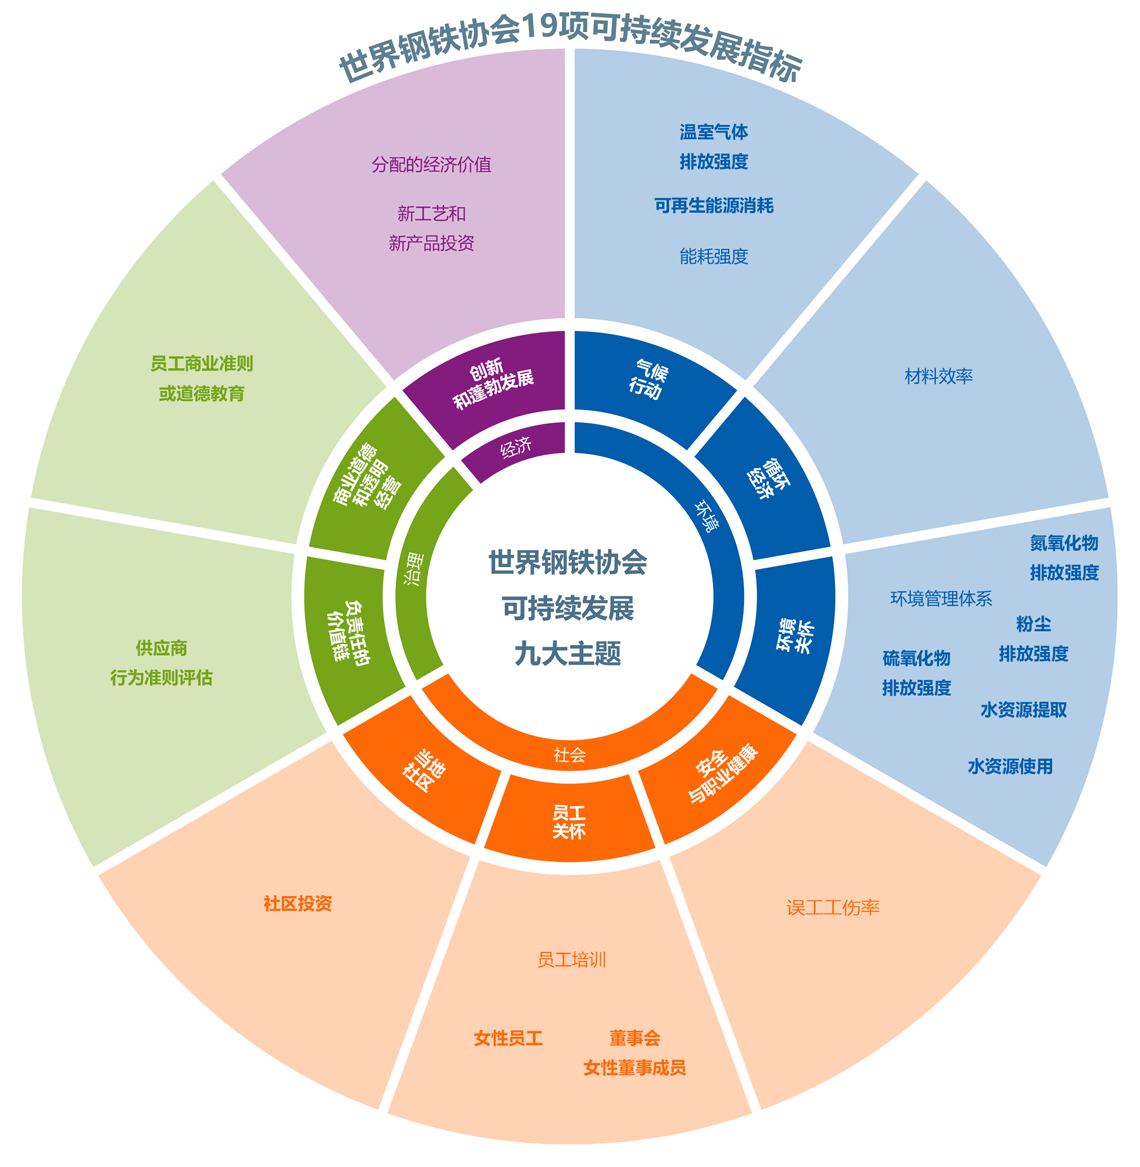
鉴于可持续发展挑战的相互关联性,钢铁行业将监测框架从8项指标扩展到19项,为环境、社会和治理绩效提供了更全面的视角。这一演变强化了我们的共同动力,即更全面地认识我们行业的影响,并将这种认识转化为可测量的、持久性的进步。
粗体显示的指标为2024年新增指标。
更多关于可持续发展原则,请访问世界钢铁协会网站:worldsteel.org。
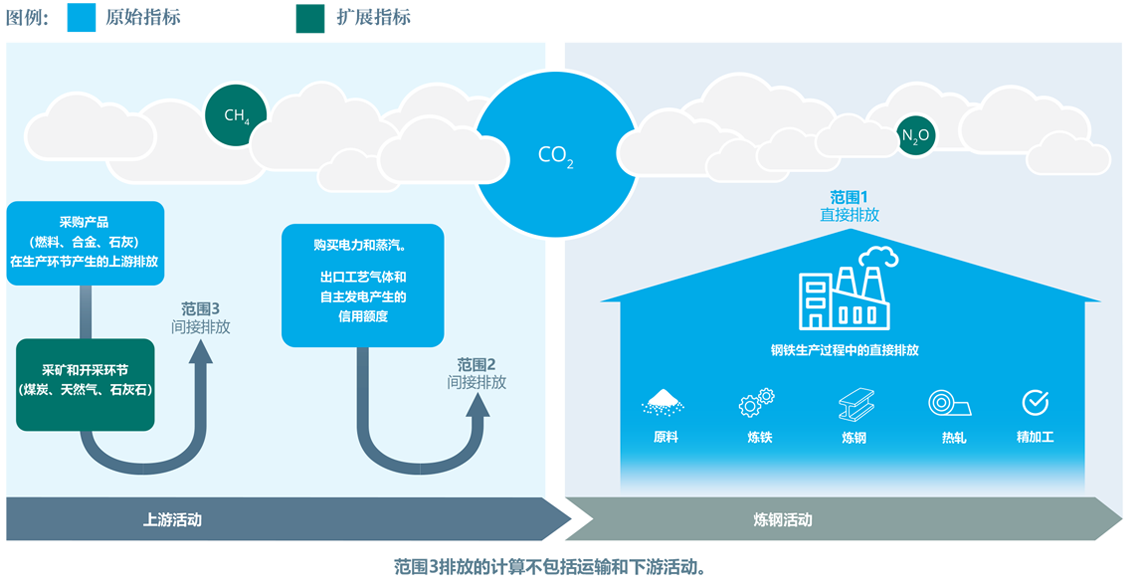
二氧化碳和温室气体排放强度
2024年温室气体排放强度
| 高炉 – 转炉流程 | 以废钢为原料的电炉流程 | 以直接还原铁为原料的电炉流程 | 全球 | |
| (废钢比~10%) | (废钢比>70%) | (废钢比<30%) | ||
| 原始指标 | 2.34 | 0.69 | 1.47 | 1.92 |
| 直接排放的甲烷和一氧化二氮(全球变暖潜能值100%) | 0.09 | <0.01 | <0.01 | – |
| 仅限上游采矿业排放的二氧化碳 | <0.01 | <0.01 | 0.01 | – |
| 上游采矿业排放的甲烷和一氧化二氮(全球变暖潜能值100%) | 0.23 | 0.03 | 0.18 | – |
| 扩展指标 | 2.66 | 0.71 | 1.66 | 2.18 |
2022-2024年的二氧化碳排放强度和能耗强度 (2026年2月新增)
| 按生产工艺划分的CO2排放强度 | 按生产工艺划分的能耗强度 | |||||
| 吨二氧化碳当量/吨粗钢 | 吉焦/吨粗钢 | |||||
| 2022 | 2023 | 2024 | 2022 | 2023 | 2024 | |
| 全球平均水平 | 1.92 | 1.92 | 1.92 | 21.01 | 21.30 | 20.95 |
| 高炉-转炉流程(BF-BOF) | 2.33 | 2.33 | 2.34 | 23.98 | 24.24 | 23.88 |
| 以废钢为原料的电炉流程(Scrap-EAF) | 0.67 | 0.69 | 0.69 | 10.13 | 10.21 | 9.84 |
| 以直接还原铁为原料的电炉流程(DRI-EAF*) | 1.36 | 1.43 | 1.47 | 22.25 | 23.13 | 23.30 |
* 目前世界钢铁协会尚未收集有关采用直接还原铁工艺生产粗钢的相关数据。因此,本计算中的分母由世界钢铁协会数据管理团队根据协会收集的数据库中的信息进行核算。
指标发展趋势
历史绩效指标
| 环境 | 社会 | 经济 | |||||||
| 1a | 1b | 2 | 3 | 4 | 5 | 6 | 7 | 8 | |
| 温室气体 排放强度 | 二氧化碳排放强度 | 能耗强度 | 材料效率 | 环境管理体系 | 误工工伤率 | 员工培训 | 新工艺和新产 品投资 | 分配的经济价值 | |
| 吨二氧化碳当 量/吨粗钢 | 吨二氧化碳/吨粗钢 | 吉焦/吨粗钢 | 总产出材料转化为产品和共生产品的比例(%) | 在通过环境管 理体系认证的生产设施中工作的员工和协力工比例(%) | 工伤次数/百万工时 | 培训天数/员工 | 占营业收入比例(%) | 占营业收入比例(%) | |
| 2024 | 2.18* | 1.92 | 20.95 | 92.79 | 96.08 | 0.72 | 6.77 | 8.31 | 100.68 |
| 2023 | 1.92 | 21.30 | 93.14 | 90.82 | 0.76 | 8.98 | 7.27 | 98.83 | |
| 2022 | 1.92 | 21.01 | 97.60 | 97.19 | 0.85 | 8.22 | 6.37 | 96.57 | |
| 2021 | 1.92 | 21.03 | 97.47 | 95.67 | 0.85 | 7.63 | 6.34 | 92.80 | |
| 2020 | 1.89 | 20.43 | 97.96 | 96.21 | 0.77 | 7.20 | 8.03 | 97.79 | |
| 2019 | 1.83 | 19.86 | 97.49 | 97.16 | 0.83 | 6.90 | 7.05 | 98.27 | |
| 2018 | 1.81 | 19.53 | 96.33 | 97.07 | 0.84 | 6.48 | 6.12 | 94.18 | |
| 2017 | 1.83 | 19.93 | 96.49 | 96.49 | 0.97 | 6.26 | 5.79 | 95.43 | |
| 2016 | 1.87 | 20.32 | 97.64 | 96.85 | 1.01 | 7.11 | 7.71 | 96.64 | |
| 2015 | 1.87 | 20.25 | 97.36 | 93.59 | 1.17 | 6.75 | 8.22 | 100.09 | |
| 2014 | 1.80 | 19.76 | 97.47 | 94.05 | 1.39 | 6.27 | 7.32 | 96.31 | |
| 2013 | 1.82 | 20.08 | 98.00 | 90.18 | 1.60 | 7.80 | 8.53 | 96.83 | |
| 2012 | 1.75 | 19.63 | 96.48 | 89.53 | 1.45 | 7.88 | 10.05 | 99.77 | |
| 2011 | 1.76 | 19.81 | 96.11 | 89.93 | 1.91 | 7.74 | 8.28 | 95.65 | |
| 2010 | 1.80 | 20.13 | 97.48 | 87.60 | 2.29 | 6.95 | 8.80 | 93.46 | |
| 2009 | 1.81 | 20.49 | 97.94 | 88.89 | 2.46 | 8.47 | 10.22 | 90.52 | |
| 2008 | 1.79 | 20.13 | 98.03 | 86.62 | 3.09 | 8.02 | 8.24 | 78.30 | |
| 2007 | 1.80 | 20.10 | 97.94 | 85.07 | 4.44 | 11.10 | 7.76 | 78.18 | |
| 2006 | 96.49 | 84.78 | 4.55 | 10.52 | 7.90 | ||||
| 2005 | 96.96 | 82.69 | 4.15 | 12.28 | 6.91 | ||||
| 2004 | 96.78 | 92.40 | 4.81 | 11.62 | 6.96 | ||||
| 2003 | 96.09 | 90.92 | 7.46 | 6.37 | |||||
* 2024年开始收集粗钢温室气体排放量/吨粗钢(范围1、范围2和范围3—类别1)指标的数据。
2015年—2024年指标发展趋势
| Year | tonnes CO2/ tonne crude steel cast | GHG emissions |
| 2015 | 1.87 | |
| 2016 | 1.87 | |
| 2017 | 1.83 | |
| 2018 | 1.81 | |
| 2019 | 1.83 | |
| 2020 | 1.89 | |
| 2021 | 1.92 | |
| 2022 | 1.92 | |
| 2023 | 1.92 | |
| 2024 | 1.92 | 2.18 |
| Year | GJ/ tonne crude steel cast |
| 2015 | 20.25 |
| 2016 | 20.32 |
| 2017 | 19.93 |
| 2018 | 19.53 |
| 2019 | 19.86 |
| 2020 | 20.43 |
| 2021 | 21.03 |
| 2022 | 21.01 |
| 2023 | 21.30 |
| 2024 | 20.95 |
| Year | % of solid materials converted to products & co-products |
| 2015 | 97.36 |
| 2016 | 97.64 |
| 2017 | 96.49 |
| 2018 | 96.33 |
| 2019 | 97.49 |
| 2020 | 97.96 |
| 2021 | 97.47 |
| 2022 | 97.60 |
| 2023 | 93.14 |
| 2024 | 92.79 |
| Year | % of employees & contractors working in EMS – registered production facilities |
| 2015 | 93.59 |
| 2016 | 96.85 |
| 2017 | 96.49 |
| 2018 | 97.07 |
| 2019 | 97.16 |
| 2020 | 96.21 |
| 2021 | 95.67 |
| 2022 | 97.19 |
| 2023 | 90.82 |
| 2024 | 96.08 |
| Year | injuries per million hours worked |
| 2015 | 1.17 |
| 2016 | 1.01 |
| 2017 | 0.97 |
| 2018 | 0.84 |
| 2019 | 0.83 |
| 2020 | 0.77 |
| 2021 | 0.85 |
| 2022 | 0.85 |
| 2023 | 0.76 |
| 2024 | 0.72 |
| Year | (training days/employee) |
| 2015 | 6.75 |
| 2016 | 7.11 |
| 2017 | 6.26 |
| 2018 | 6.48 |
| 2019 | 6.90 |
| 2020 | 7.20 |
| 2021 | 7.63 |
| 2022 | 8.22 |
| 2023 | 8.98 |
| 2024 | 6.77 |
| Year | % of revenue |
| 2015 | 8.22 |
| 2016 | 7.71 |
| 2017 | 5.79 |
| 2018 | 6.12 |
| 2019 | 7.05 |
| 2020 | 8.03 |
| 2021 | 6.34 |
| 2022 | 6.37 |
| 2023 | 7.27 |
| 2024 | 8.31 |
| Year | % of revenue |
| 2015 | 100.09 |
| 2016 | 96.64 |
| 2017 | 95.43 |
| 2018 | 94.18 |
| 2019 | 98.27 |
| 2020 | 97.79 |
| 2021 | 92.80 |
| 2022 | 96.57 |
| 2023 | 98.83 |
| 2024 | 100.68 |
2025年贡献数据的企业机构
定义和计算方法
相关性
| 环境绩效 | |||||
| 指标 | 相关性 | 可持续发展原则 | 相关的联合国可持续发展目标* | ||
| 1 | 温室气体排放强度 | 钢铁生产是一项碳密集型活动。钢铁行业的排放大部分是二氧化碳,钢铁行业排放量占全球人为温室气体排放量的 7% – 8%。尽管如此,钢铁行业仍致力于继续减少其运营活动产生的碳足迹。要实现所需的减排目标,就必须从根本上改变钢铁的生产方式。 | 气候行动 | 主动应对气候变化,采取有效措施最大限度减少行业温室气体排放。 | 7.经济适用的清洁能源 13.气候行动 |
| 2 | 能耗强度 | 钢铁生产仍然是能源密集型活动。钢铁行业正致力于提高其运营活动的能源效率,并增加低碳资源的使用比例。 | |||
| 3 | 可再生能源消耗 | 向可再生能源转型对于减少钢铁生产的碳足迹至关重要。提高可再生能源在运营中的占比,有助于实现脱碳并提高长期能源安全性。 | |||
| 4 | 材料效率 | 在钢铁行业内部和外部回收和使用共生产品(副产品),再结合对自然资源的负责任管理,这有助于提高材料效率和完善循环经济。 | 循环经济 | 在钢铁产品的全生命周期内,最大限度地有效利用资源,支持全社会实现循环经济。 | 12. 负责任的消费和生产 |
| 5 | 环境管理体系 | 办理环境管理体系认证是管理环境绩效和确保合法合规的有效办法。 | 环境关怀 | 以对环境负责任的方式开展生产经营活动。 | 3. 良好的健康与福祉 6. 清洁饮水和卫生设施 11. 可持续城市和社区 12. 负责任的消费和生产 14. 水下生物 15. 地上生物 |
| 6 | 硫氧化物排放强度 | 监测和减少硫氧化物排放对于最大限度地减少对环境的影响、保护人类健康和生态系统至关重要。 | |||
| 7 | 氮氧化物排放强度 | 监测和减少氮氧化物排放对于最大限度地减少对环境的影响、保护人类健康和生态系统至关重要。 | |||
| 8 | 粉尘排放强度 | 控制和减少粉尘排放有助于提高工作环境的清洁度,并减少对周边社区的影响。 | |||
| 9 | 水资源提取 | 水是钢铁生产所需的重要资源。监测和管理淡水取水量,可确保负责任地用水,并最大限度地减少对当地水源和生态系统的影响。 | |||
| 10 | 水资源利用 | 通过回收利用和高效的水资源管理来减少淡水使用,有助于实现可持续运营,并有助于保护当地社区和生态系统的水资源供应。 | |||
| 社会绩效 | |||||
| 指标 | 相关性 | 可持续发展原则 | 相关的联合国可持续发展目标* | ||
| 11 | 误工工伤率 | 钢铁行业能够并且必须预防所有工伤和职业疾病。衡量安全绩效是安全和健康达标的一个方面。 | 安全与职业健康 | 保持安全和健康的工作环境,在职业健康、安全事故、安全风险和改进机遇方面采取行动 | 3. 良好的健康与福祉 8. 体面工作与经济增长 |
| 12 | 员工培训 | 人力资本是所有组织的一项关键资产,也是创造价值的一项主要驱动力。 培训计划的目标是扩大员工的知识和技能,帮助他们最大限度地发挥自身才能。 | 员工关怀 | 在为员工提供一个包容和公平的工作环境的同时,使员工有机会挖掘自我发展潜力。 | 4. 优质教育 5. 性别平等 8. 体面工作与经济增长 |
| 13 | 女性员工 | 保持员工队伍的多样性,能够增强组织的绩效和创新能力。提高女性在企业各个领域的代表性,有助于促进包容性和性别平等。 | |||
| 14 | 董事会女性董事成员 | 领导层中均衡的代表性有助于提高决策质量,并体现公司在各个治理层面上对多元化和平等的承诺。 | |||
| 15 | 社区投资 | 钢铁生产与当地社区的福祉息息相关。投资于社区发展,有助于社会包容、地方经济发展和创造长期共享价值。 | 当地社区 | 与当地社区建立信任,创造建设性社区关系。 | 11. 可持续城市和社区 |
| 经济绩效 | |||||
| 指标 | 相关性 | 可持续发展原则 | 相关的联合国可持续发展目标* | ||
| 16 | 新工艺和新产品投资 | 对新工艺和研发的投资有助于实现钢铁行业的可持续发展。 | 创新与蓬勃发展 | 追 求技术和产品创新,实现经济的可持续发展。 | 1. 无贫穷 8. 体面工作与经济增长 9. 产业、创新和基础设施 |
| 17 | 分配的经济价值 | 钢铁对经济增长至关重要。要量化企业创造的价值,并确定这些财富中有多少分配给了社会,这项工作具有重要意义。 | |||
| 治理绩效 | |||||
| 指标 | 相关性 | 可持续发展原则 | 相关的联合国可持续发展目标* | ||
| 18 | 供应商行为准则评估 | 负责任的采购实践有助于确保供应商遵守环境、社会和道德标准,从而加强整个价值链的可持续性。 | 负责任的价值链 | 在整个价值链上引导负责任的经营实践 | 12. 负责任的消费和生产 |
| 19 | 员工商业准则或道德教育 | 道德意识和负责任的行为是维护信任和廉洁的关键。商业道德教育有助于员工秉持高标准的透明度和问责制。 | 商业道德和透明经营 | 以高标准和透明的流程开展生产经营。 | 17. 和平、正义与强大机构 |
* 联合国可持续发展目标