Foreword

We have said many times that the steel industry is at the heart of the global economy and equally so at the core of our sustainable modern society. Despite the influence of the pandemic, through its different regional impacts, the global steel industry was fortunate to end 2020 with only a minor contraction in steel demand. Steel use in China expanded while it contracted in the rest of the world. We look forward to normalisation in demand during 2021, owing to steady progress on vaccines and changed behaviour in the global society.
We believe that the pandemic has accelerated some key trends, which will bring about shifts in steel demand. The steel industry will see exciting opportunities from rapid developments through digitisation and automation, infrastructure initiatives, reorganisation of urban centres and energy transformation.
Climate change will equally influence our industry. A number of our members participate in our step up programme and have seen highly beneficial results. This is just one of the many elements on the road to delivering the industry’s three-track approach to help manage the impact of climate change. Our focus is on substantially improved efficiency, maximising scrap use and developing breakthrough technologies.
This booklet provides a comprehensive overview of steel industry activities. For any comments, please do not hesitate to contact me.
Dr Edwin Basson
Director General
Key points from this report
Steel is essential to our society
As a permanent material which can be recycled over and over again without losing its properties, steel is fundamental to a successful circular economy. From transport systems, infrastructure and housing, to manufacturing, agriculture or energy, the industry is continuing to expand its offer of advanced high-strength steels which reduce the weight of applications and encourage circular economy practices.
worldsteel initiatives
Market development initiatives


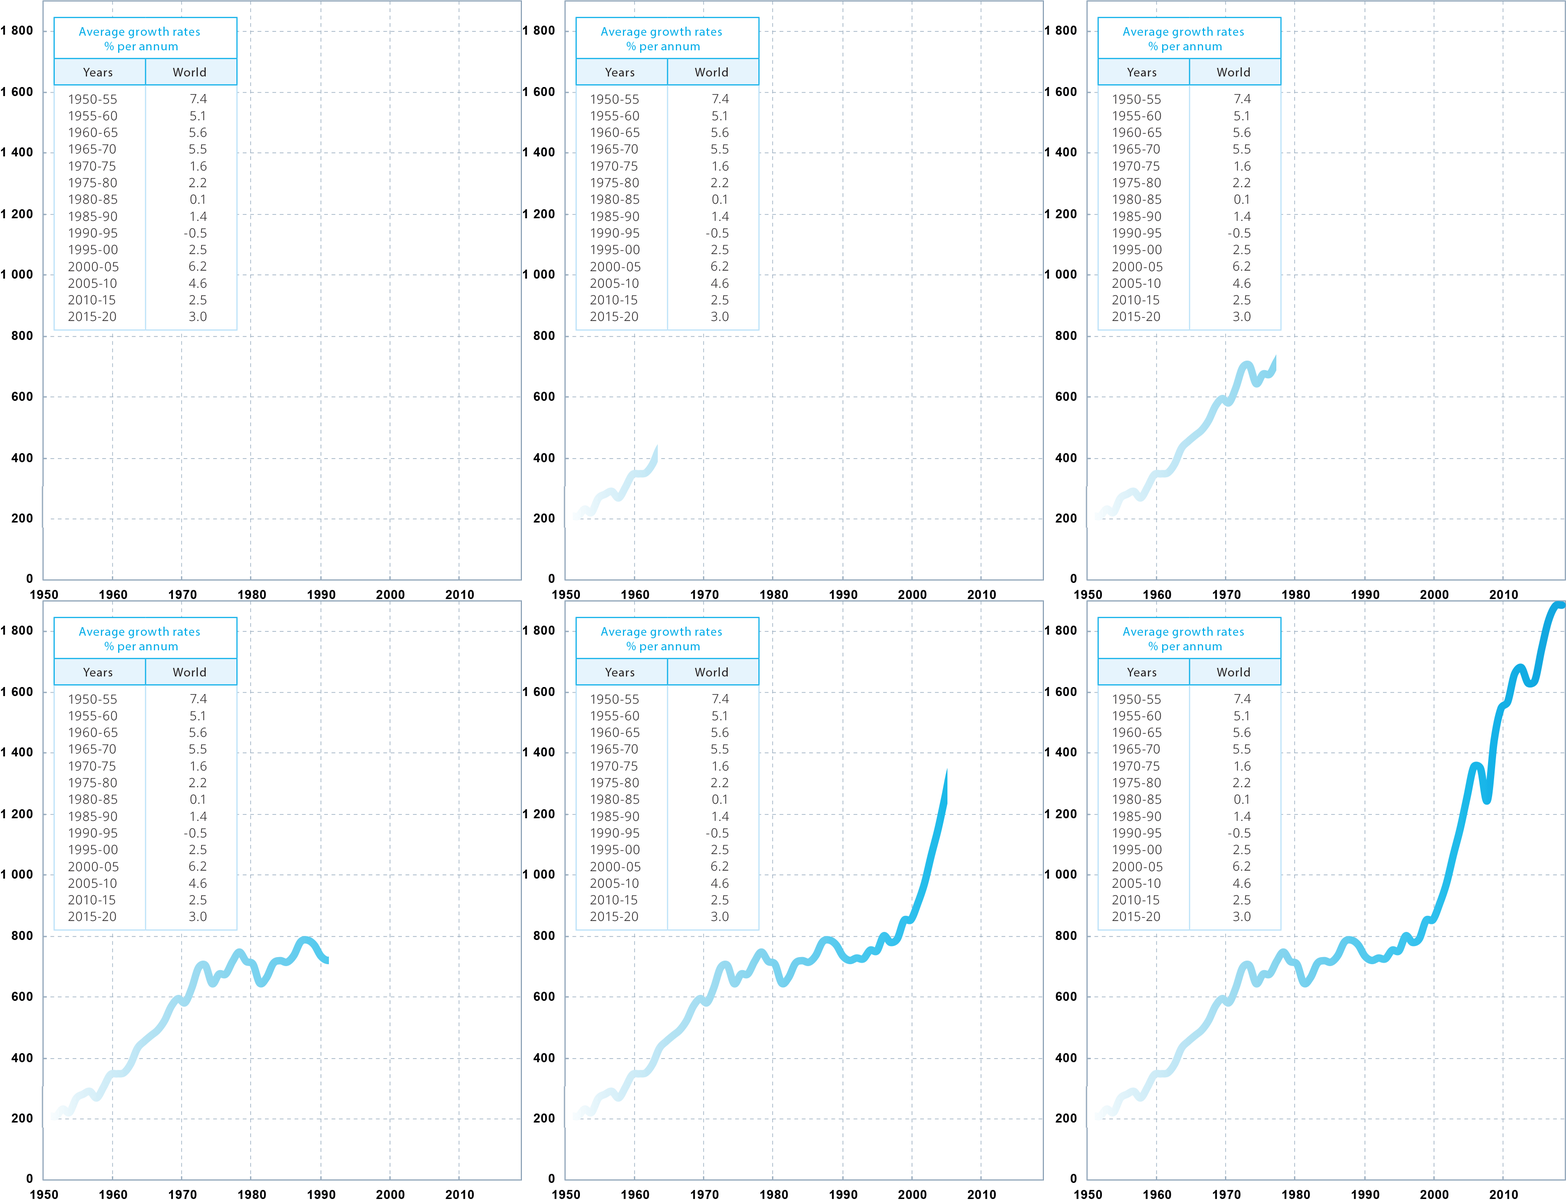
World crude steel production 1950 to 2020
million tonnes, crude steel production
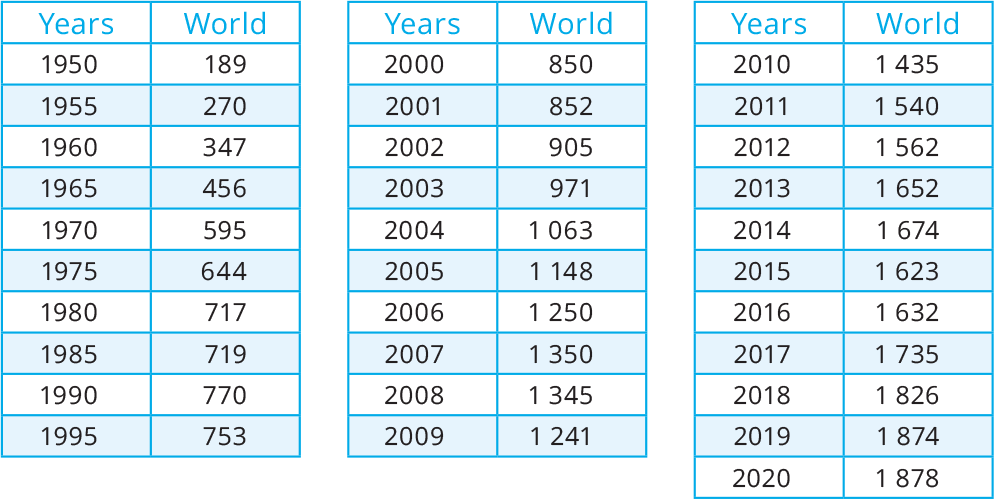
million tonnes, crude steel production
Top steel-producing companies 2020
million tonnes, crude steel production
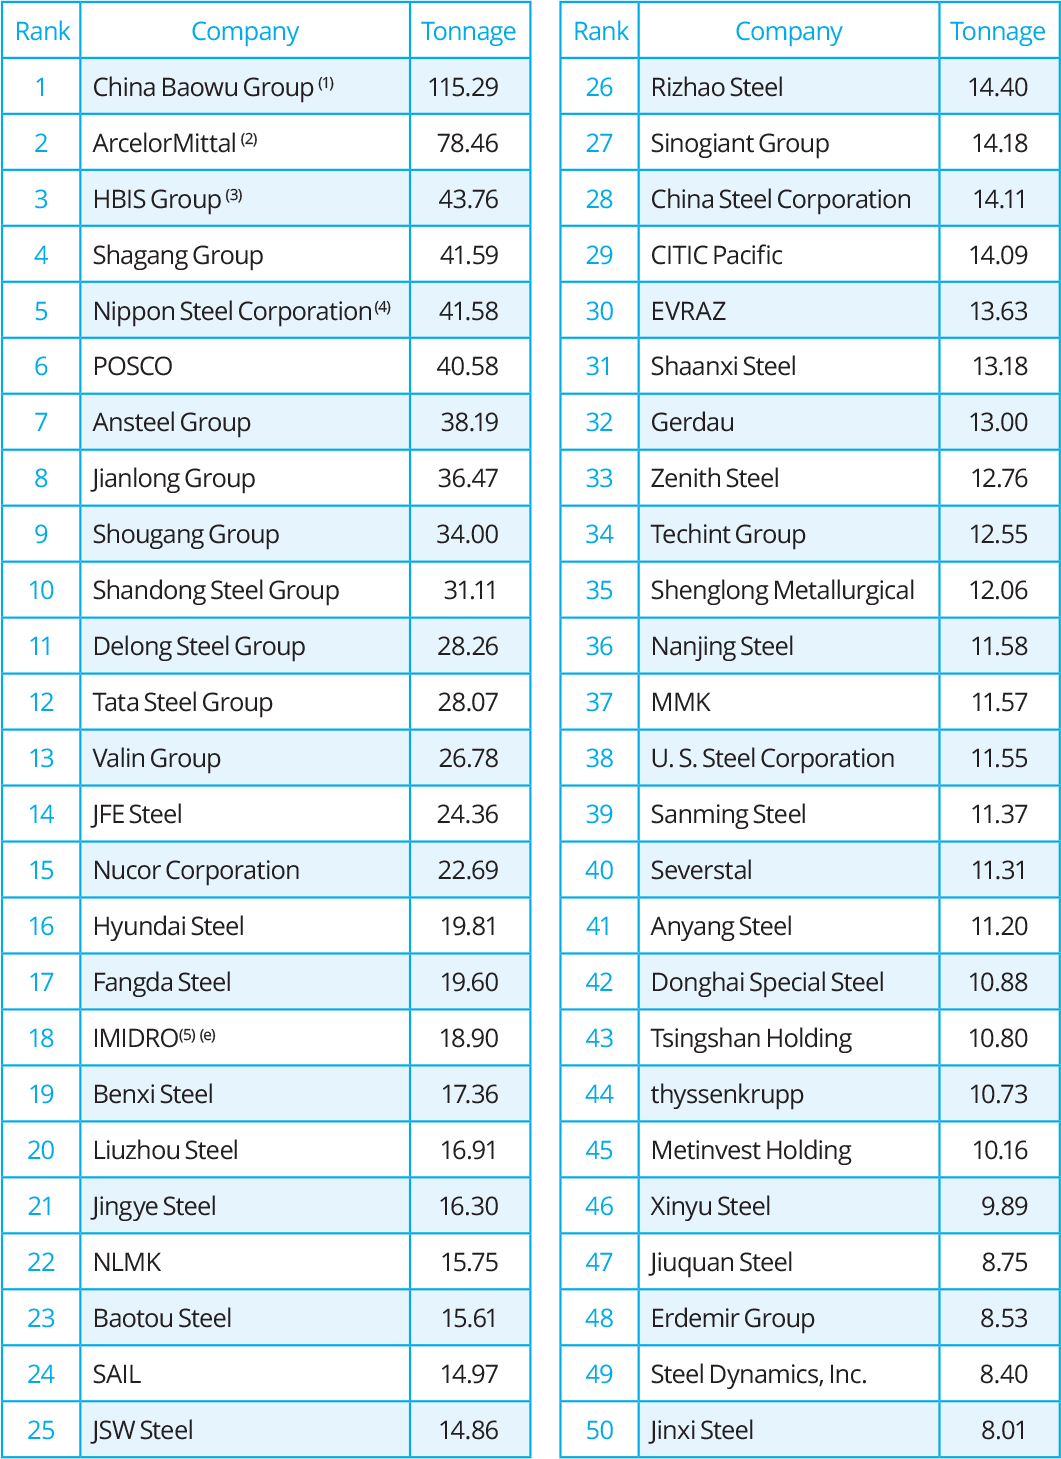
(e) = estimate
(1) Includes 2020 tonnage of Taiyuan Steel and Kunming Steel, and tonnage of Maanshan Steel and Chongqing Steel, both part of China Baowu Group from 2019
(2) Includes 60% in AM/NS India (former Essar Steel)
(3) Includes tonnage of Serbia Iron & Steel d.o.o. Beograd and MAKSTIL A.D. in Macedonia
(4) Includes Nippon Steel Stainless Steel Corporation, Sanyo Special Steel, Ovako, 40% AM/NS India and 31.2% USIMINAS
(5) Estimated combined tonnage of Mobarrakeh Steel, Esfahan Steel, Khuzestan Steel and NISCO
Notes on company ownership and tonnage calculations:
For worldsteel members, the data was sourced from their official tonnage declarations. For Chinese companies, the official CISA tonnage publication was used, unless especially noted. In case of more than 50% ownership, 100% of the subsidiary’s tonnage is included, unless specified otherwise. In cases of 30%-50% ownership, pro-rata tonnage is included. Unless otherwise specified in the declaration, less than 30% ownership is considered a minority and therefore, not included. Figures represent ownership ending 31 December 2020.
For an extended company listing, go to worldsteel.org/steel-by-topic/statistics/top-producers.
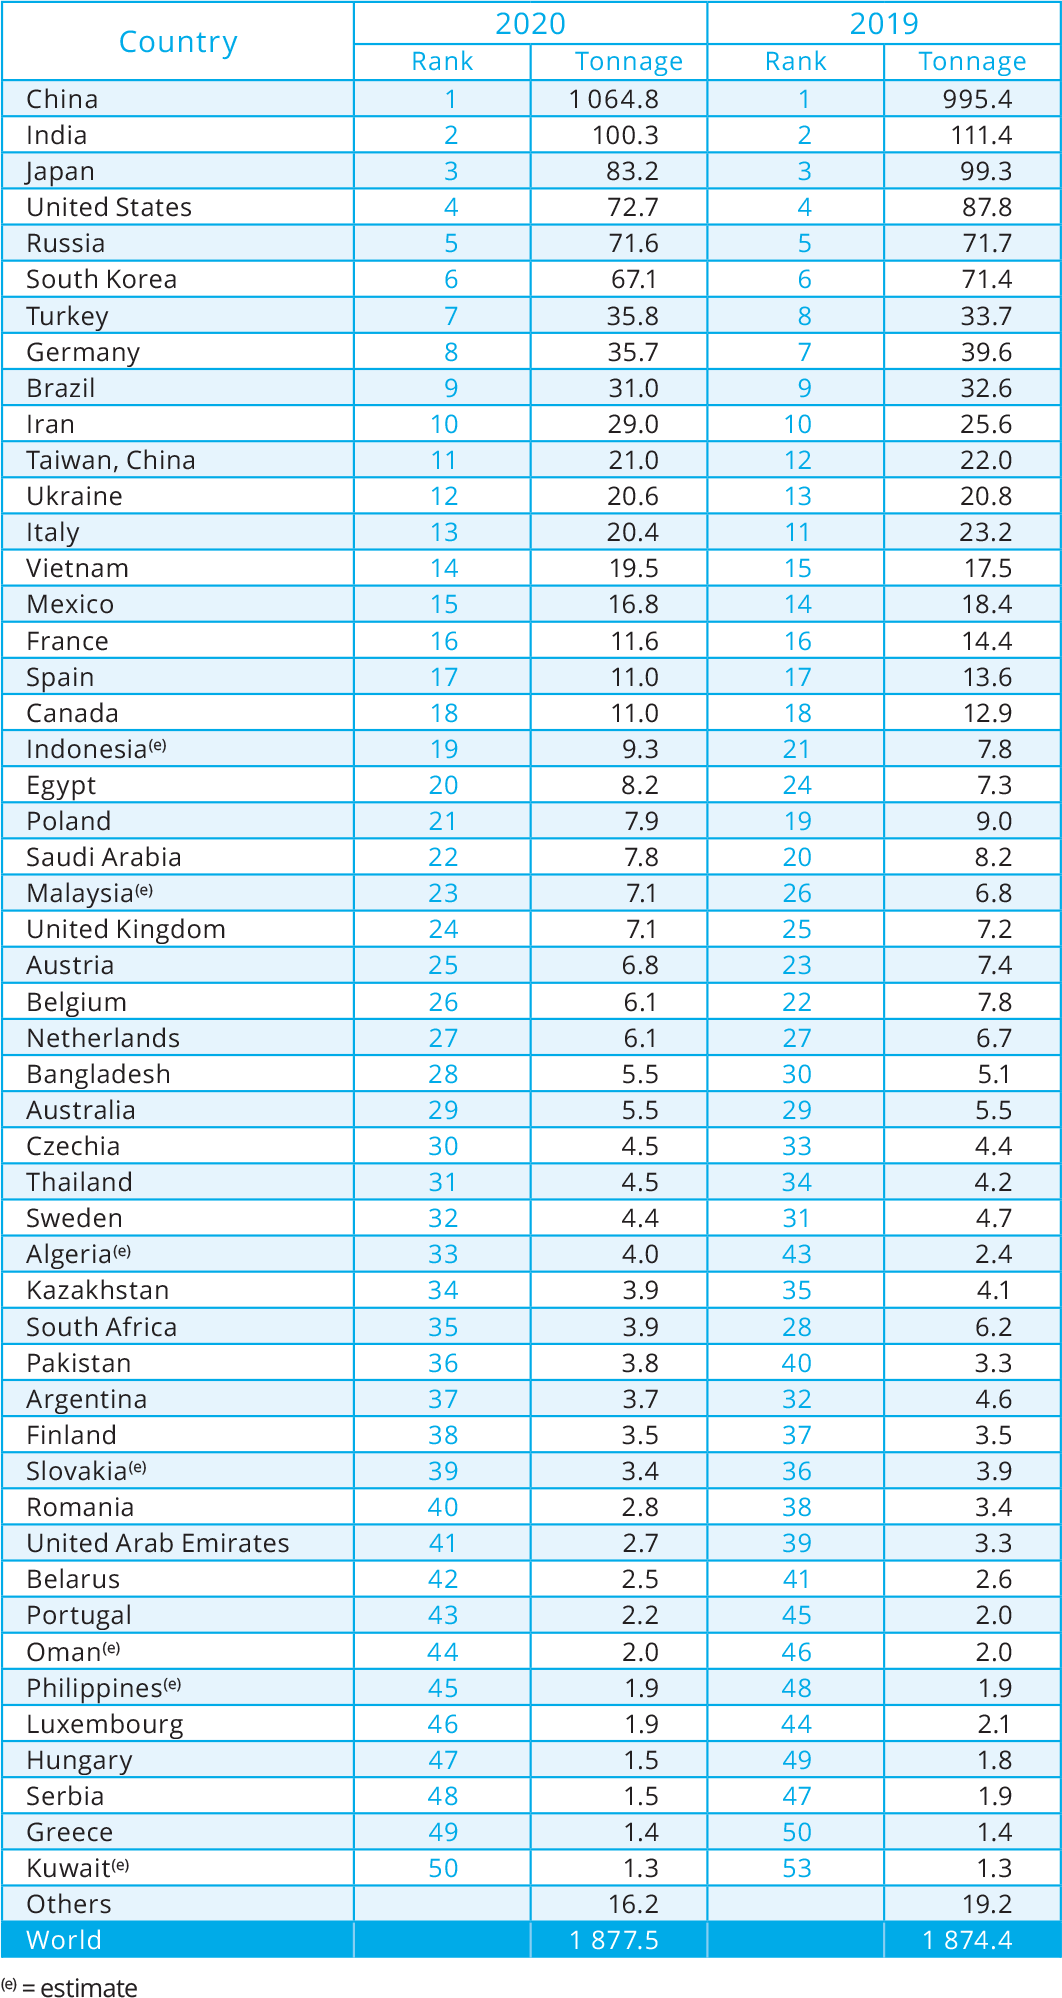
Major steel-producing countries 2019 and 2020
million tonnes, crude steel production
Crude steel production by process, 2020
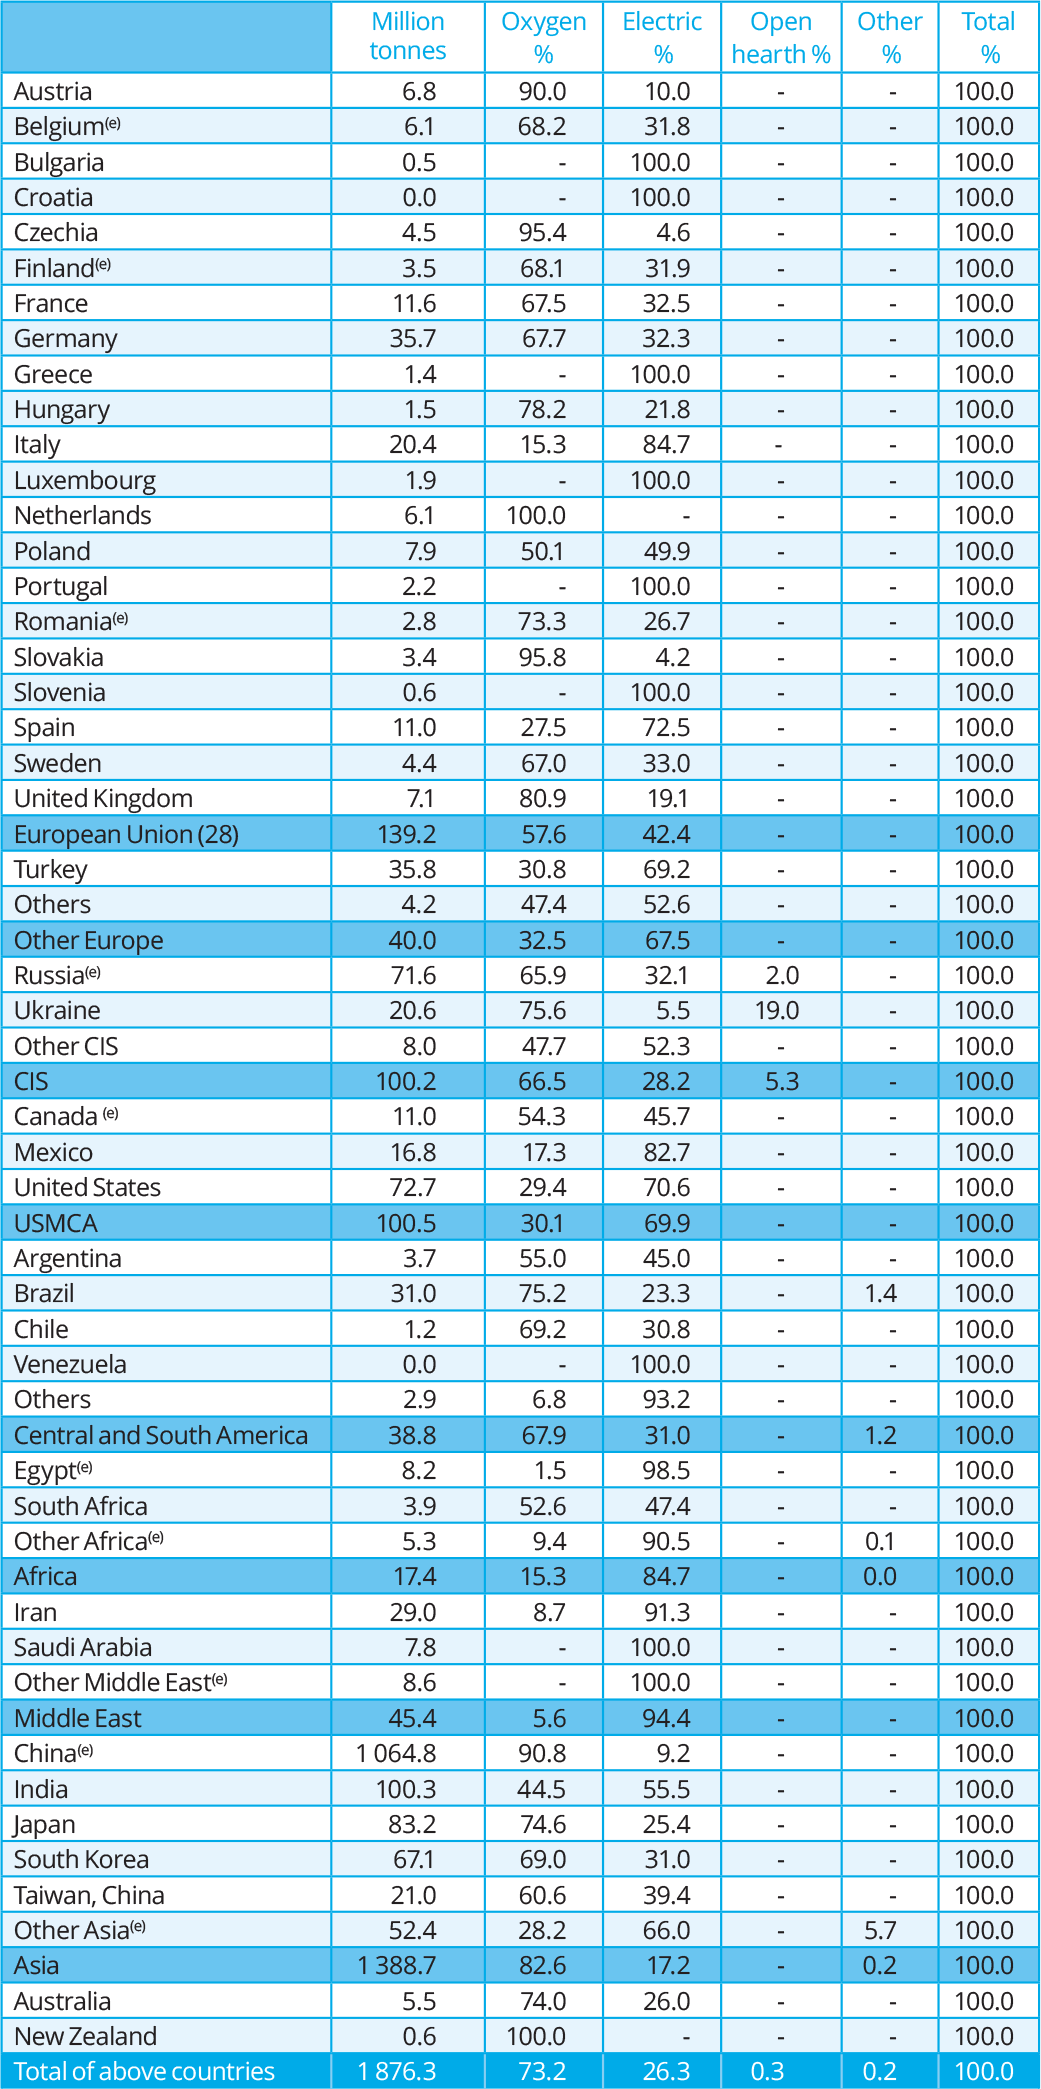
The countries in this table accounted for approximately 99.9% of world crude steel production in 2019.
(e) = estimate
Continuously-cast steel output 2018 to 2020
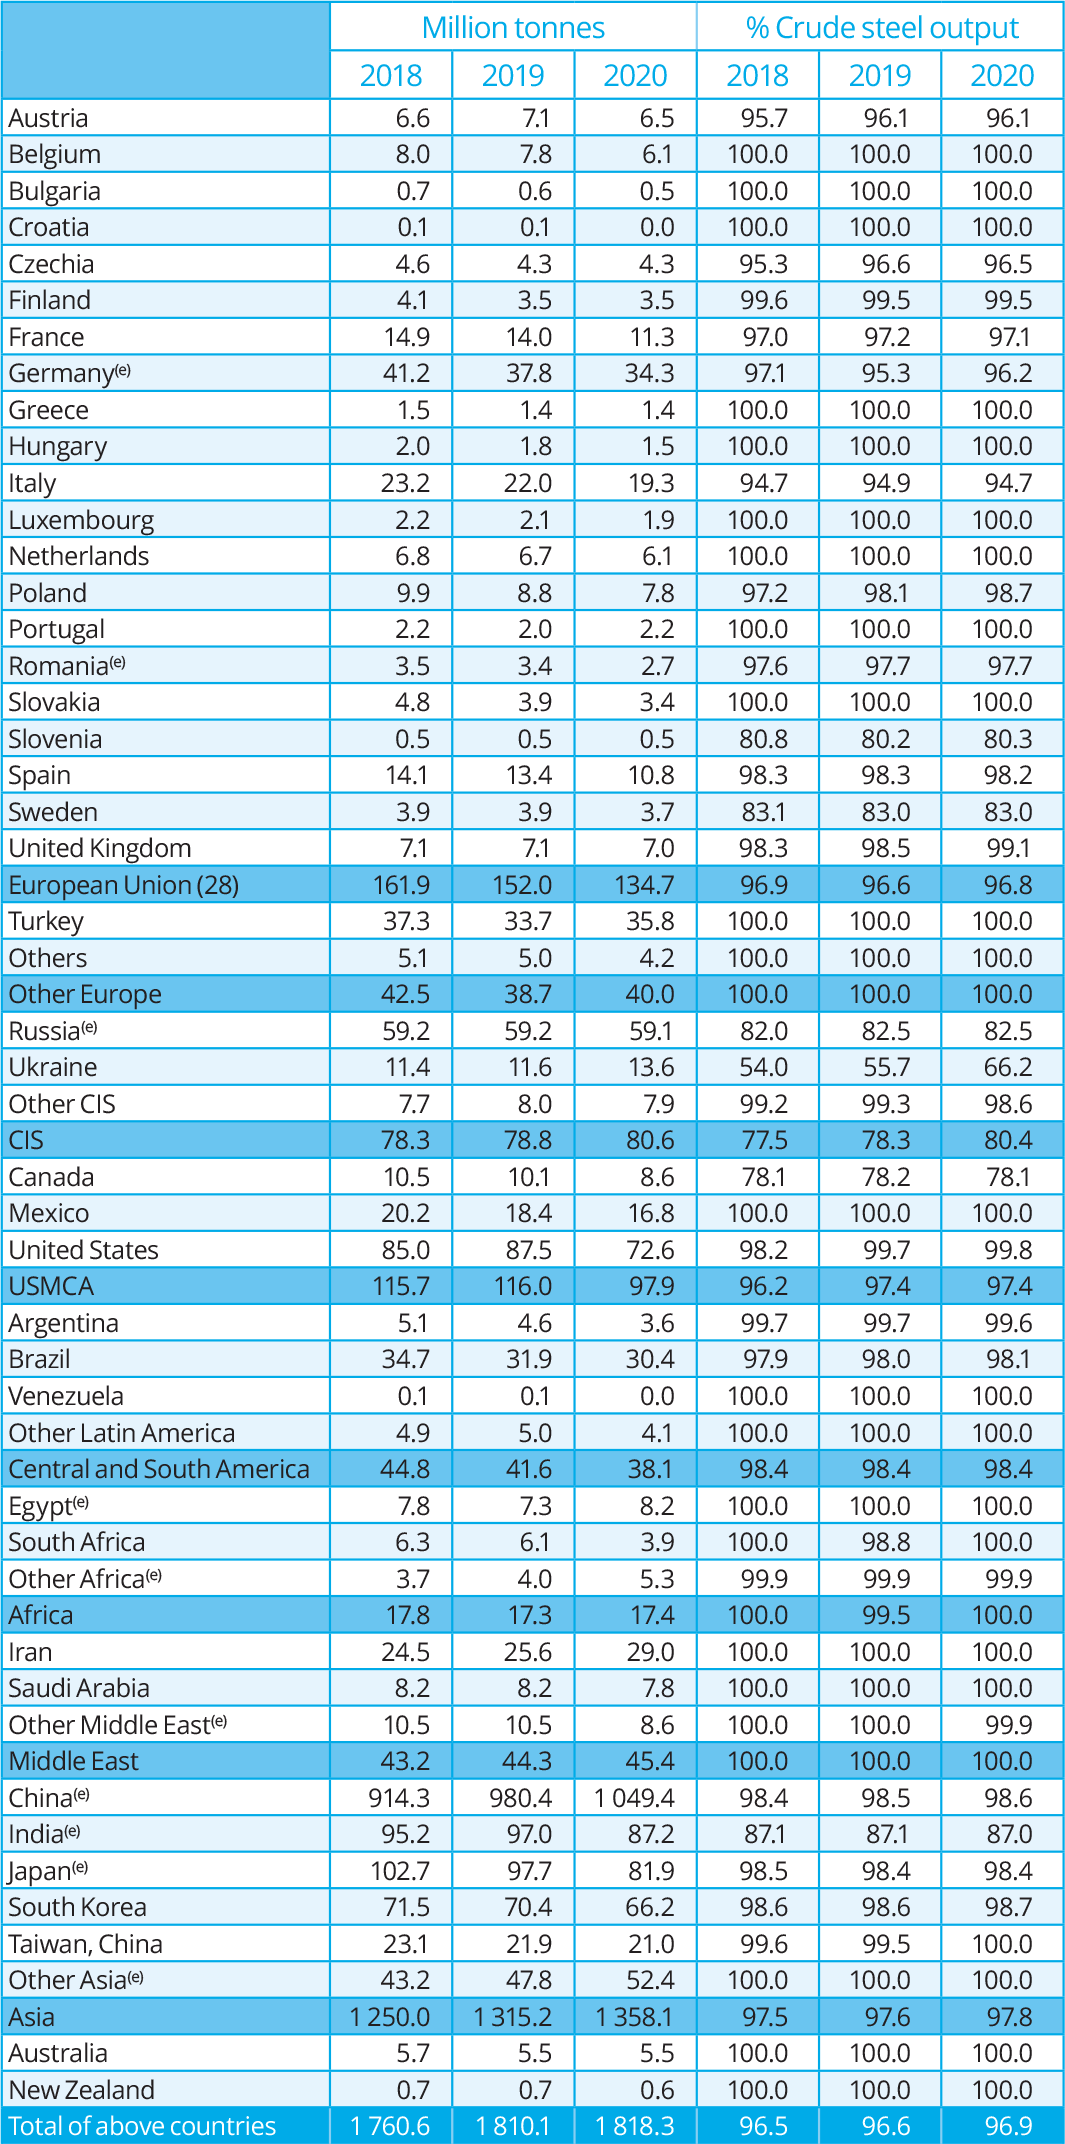
The countries in this table accounted for approximately 99.9% of world crude steel production in 2019.
(e) = estimate
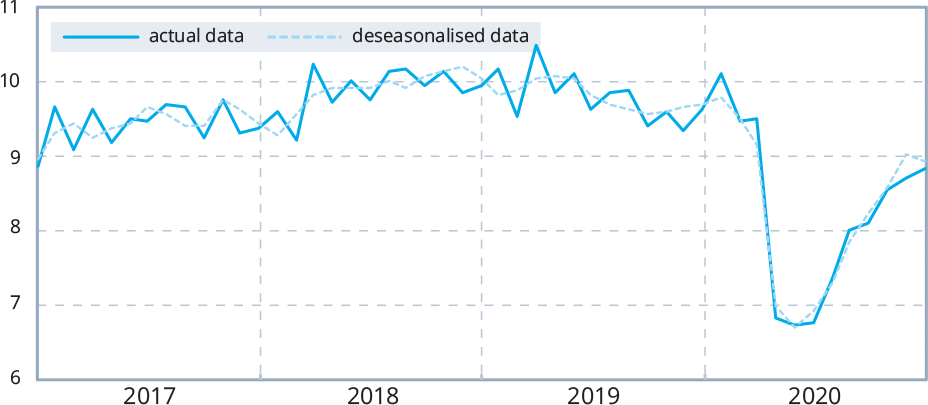
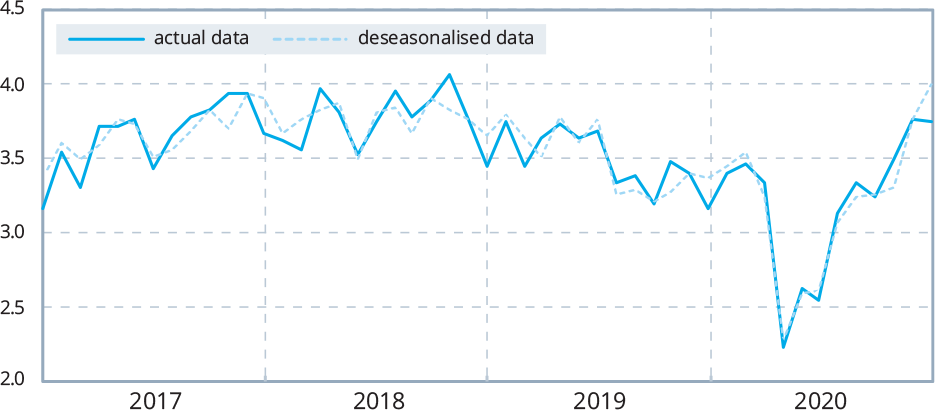
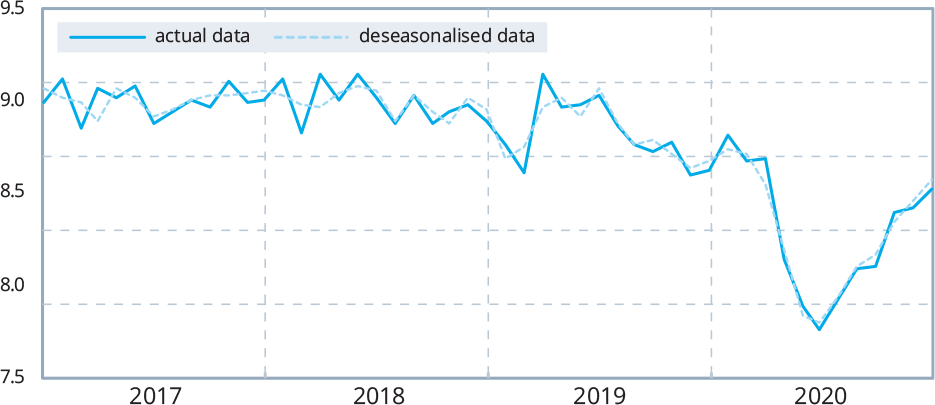
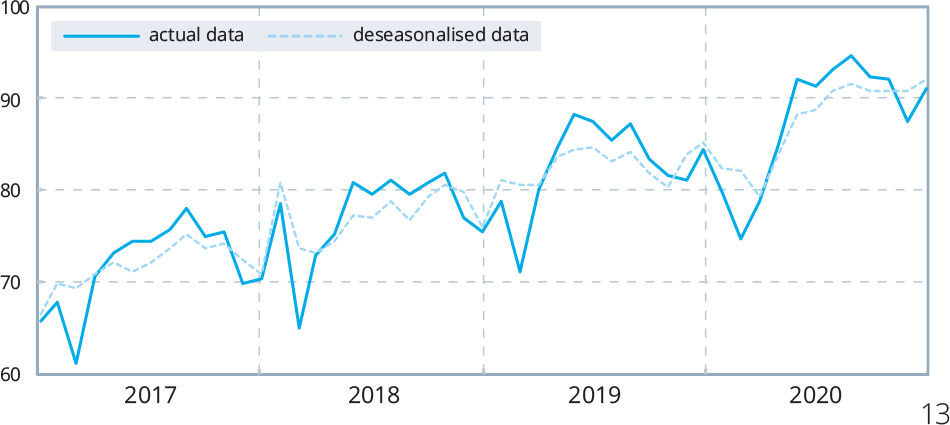
Monthly crude steel production 2017 to 2020
million tonnes
Total 65 reporting countries*
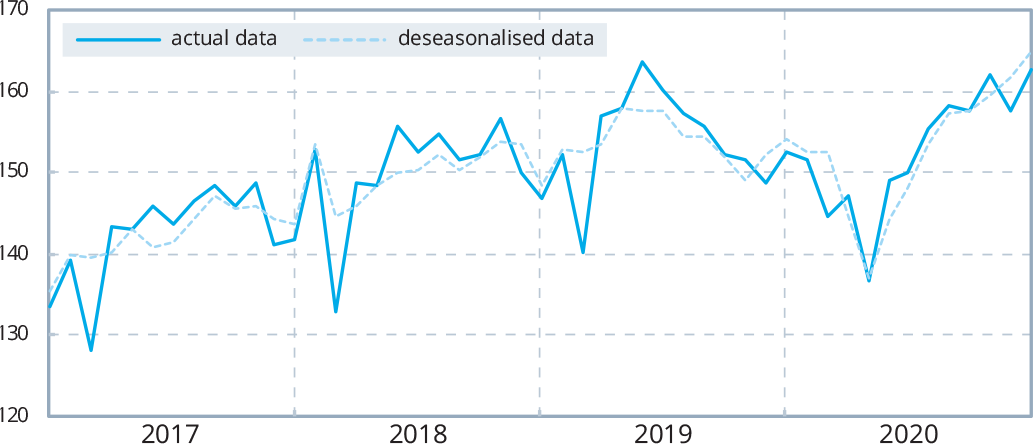
European Union (28)
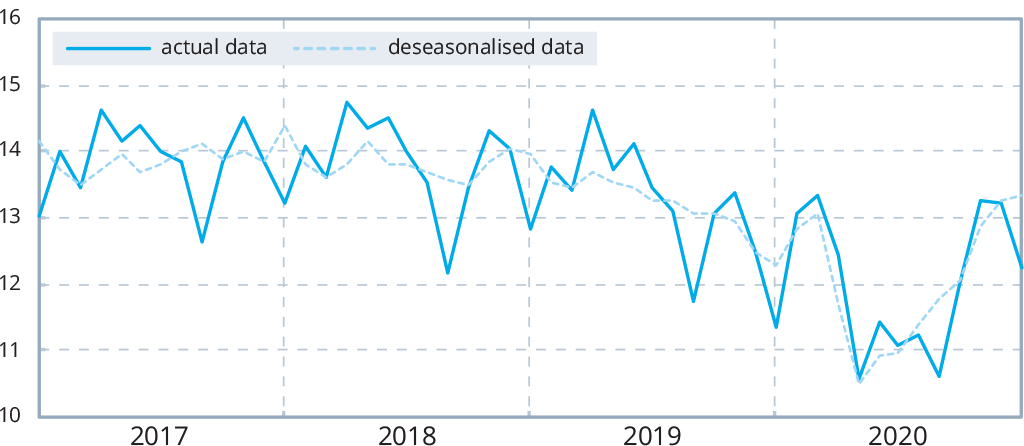
CIS (6)
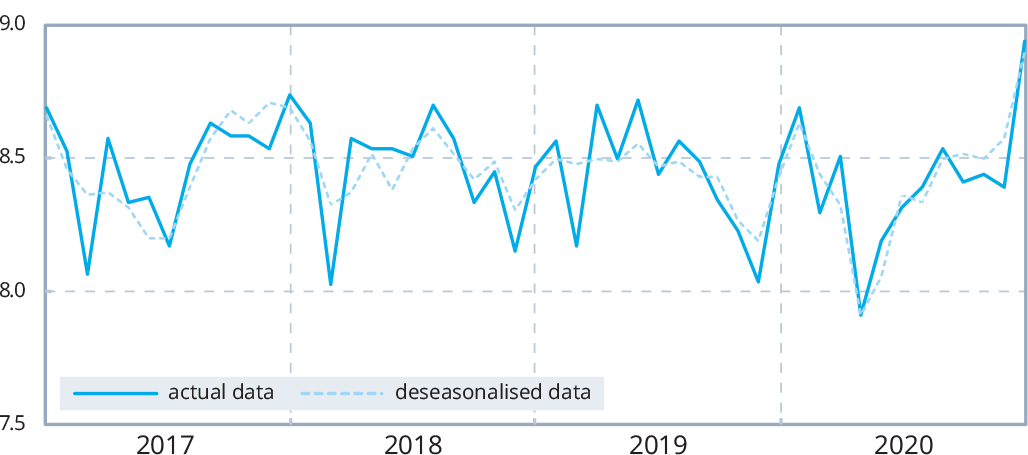
*The 65 reporting countries:
Argentina, Australia, Austria, Belgium, Bosnia-Herzegovina, Brazil, Bulgaria, Belarus, Canada, Chile, China, Colombia, Croatia, Cuba, Czechia, Ecuador, Egypt, El Salvador, Finland, France, Germany, Greece, Guatemala, Hungary, India, Iran, Italy, Japan, Kazakhstan, Libya, Luxembourg, Macedonia, Mexico, Moldova, Netherlands, New Zealand, Norway, Pakistan, Paraguay, Peru, Poland, Portugal, Qatar, Romania, Russia, Saudi Arabia, Serbia, Slovakia, Slovenia, South Africa, South Korea, Spain, Sweden, Taiwan, China, Thailand, Trinidad and Tobago, Turkey, Ukraine, United Arab Emirates, United Kingdom, United States, Uruguay, Uzbekistan, Venezuela, and Vietnam.
In 2020, these 65 countries accounted for approximately 98% of world crude steel production.
million tonnes
| USMCA
|
Central and South America
|
| Japan
|
China
|
Steel production and use: geographical distribution 2010
Crude steel production
World total: 1 435 million tonnes
Others comprise:
| Africa | 1.2% | Central and South America | 3.1% |
| Middle East | 1.4% | Australia and New Zealand | 0.6% |
Apparent steel use (finished steel products)
World total: 1 315 million tonnes
Others comprise:
| Africa | 2.4% | Central and South America | 3.5% |
| Middle East | 3.7% | Australia and New Zealand | 0.6% |
Steel production and use: geographical distribution 2020
Crude steel production
World total: 1 878 million tonnes
Others comprise:
| Africa | 0.9% | Central and South America | 2.1% |
| Middle East | 2.4% | Australia and New Zealand | 0.3% |
Apparent steel use (finished steel products)
World total: 1 772 million tonnes
Others comprise:
| Africa | 2.0% | Central and South America | 2.2% |
| Middle East | 2.6% | Australia and New Zealand | 0.3% |
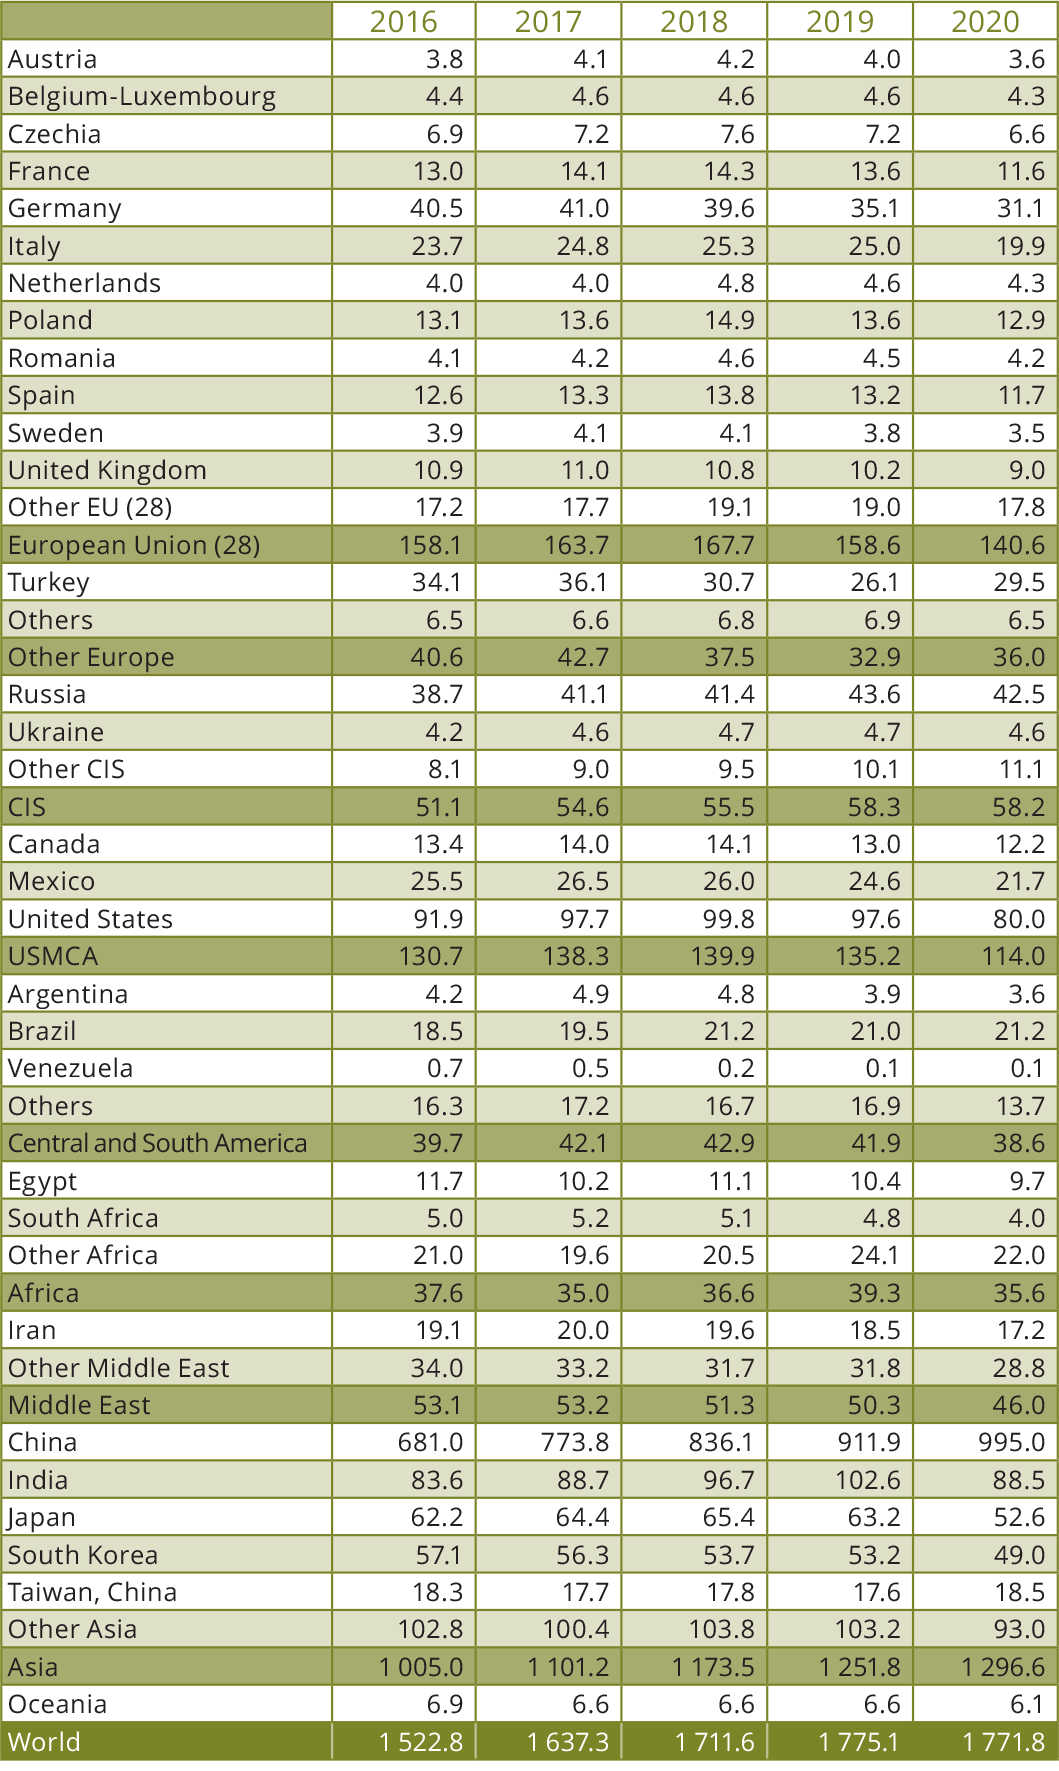
Apparent steel use 2016 to 2020
million tonnes, finished steel products
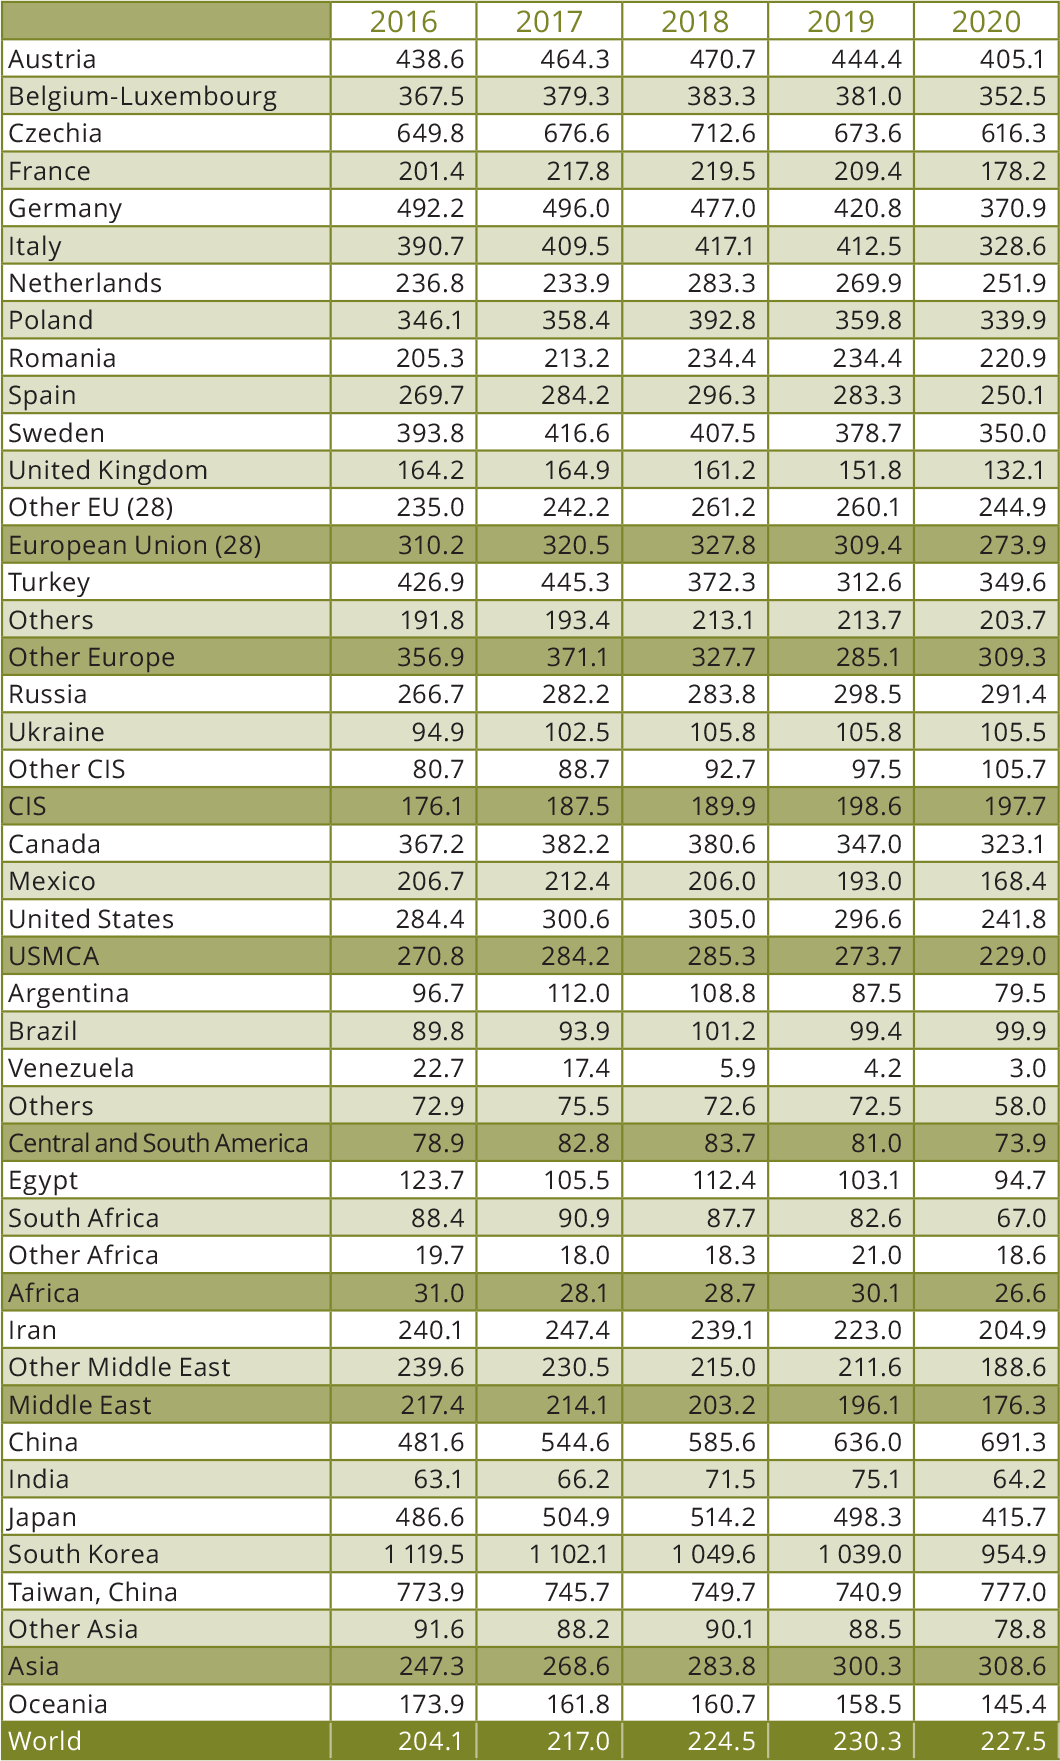
Apparent steel use per capita 2016 to 2020
kilograms, finished steel products
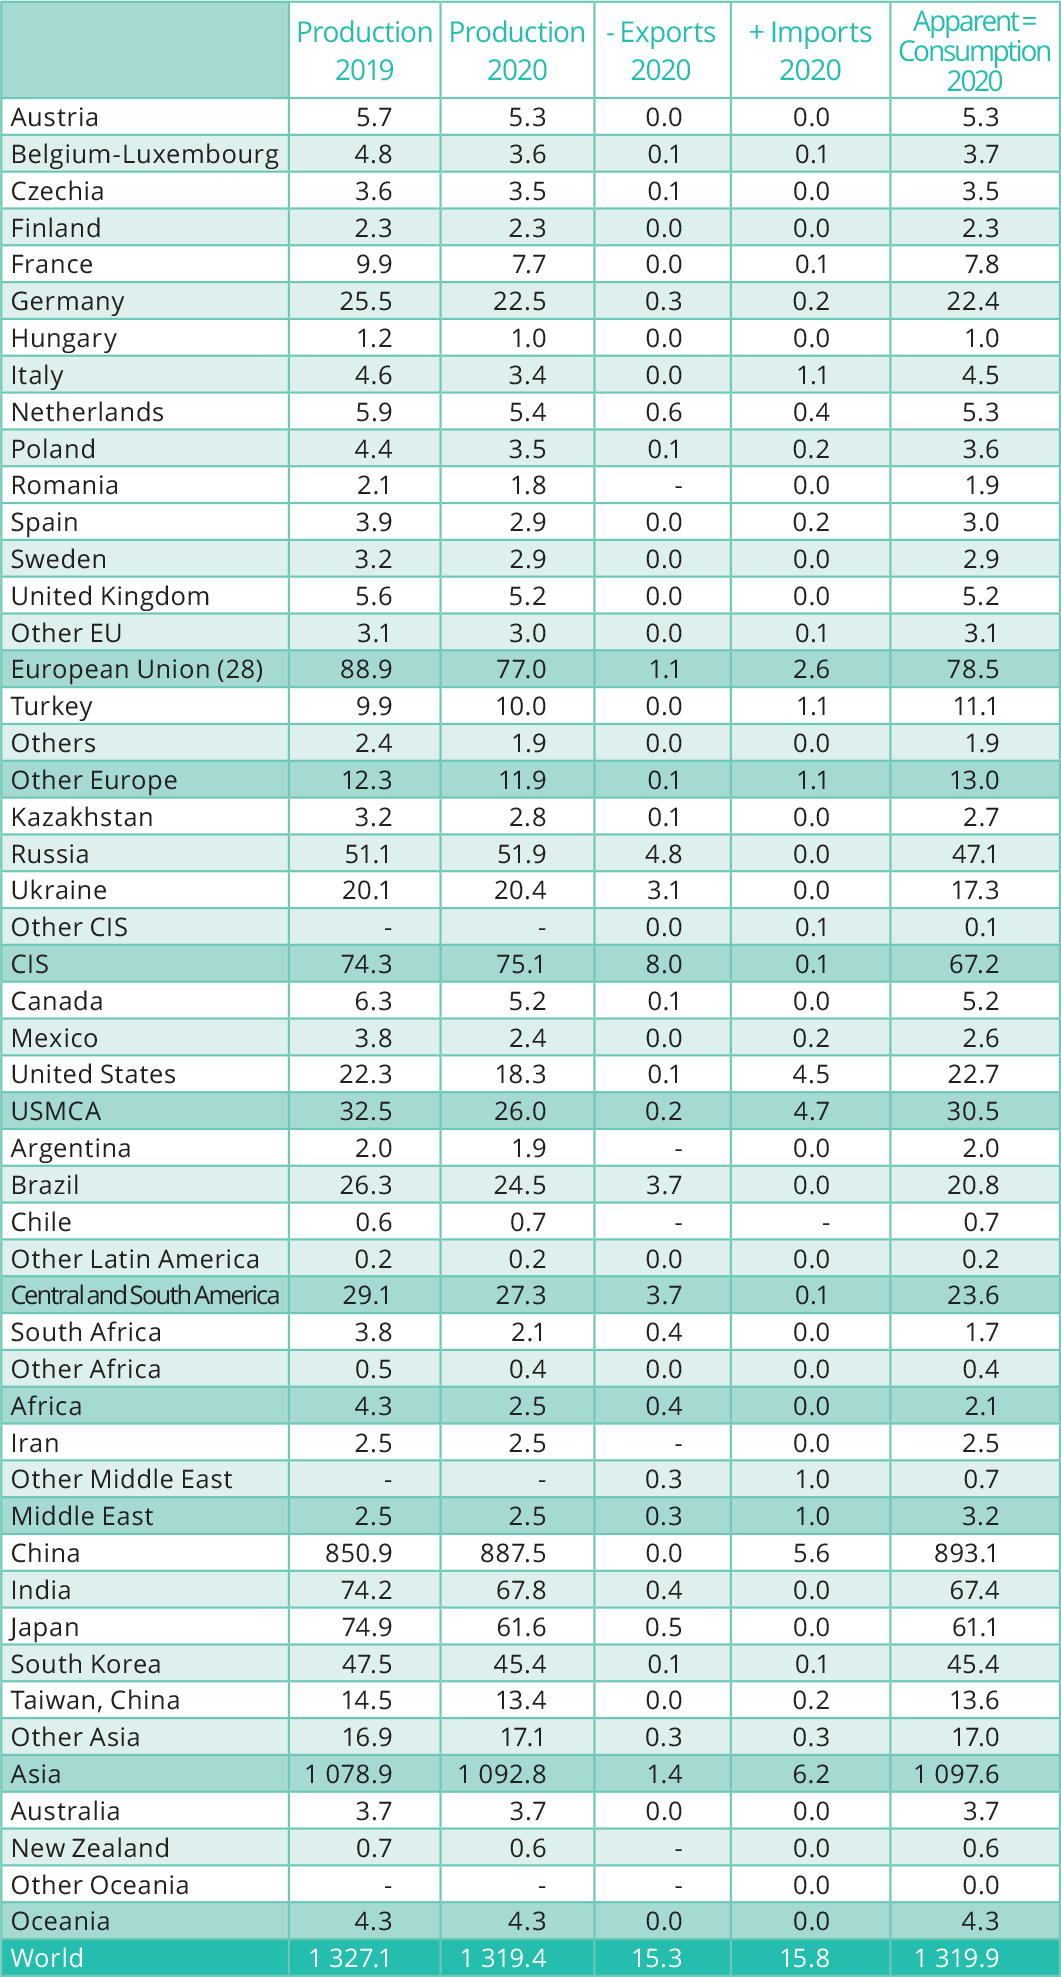
Pig iron 2019 and 2020
million tonnes
Direct reduced iron production 2016 to 2020
million tonnes
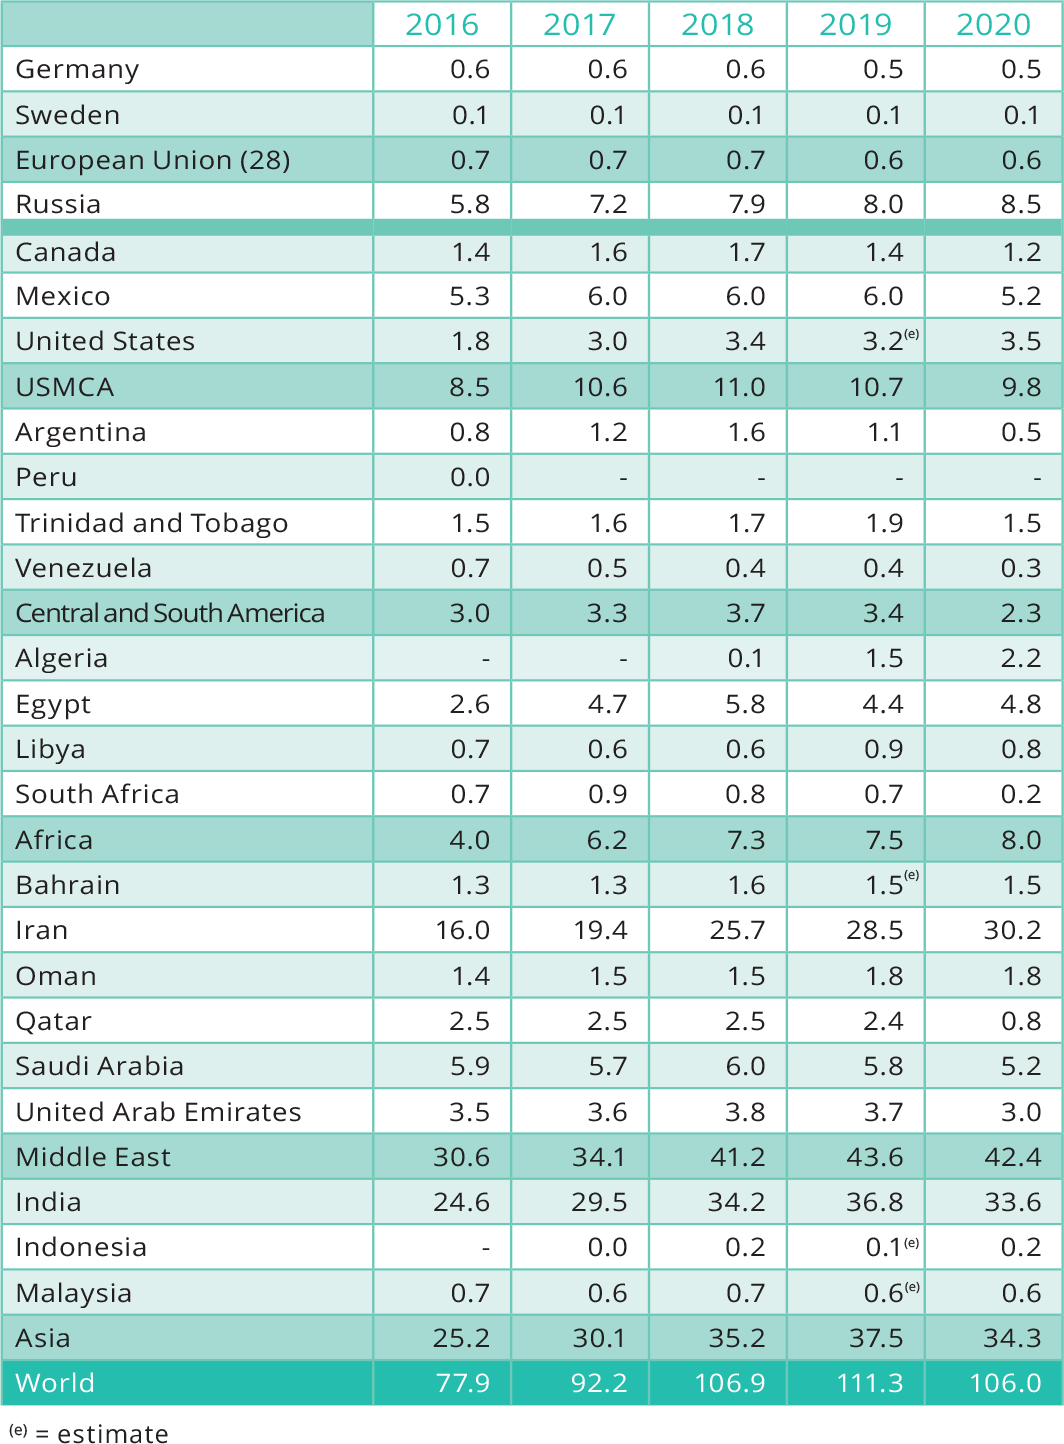
Iron ore 2019
million tonnes, actual weight
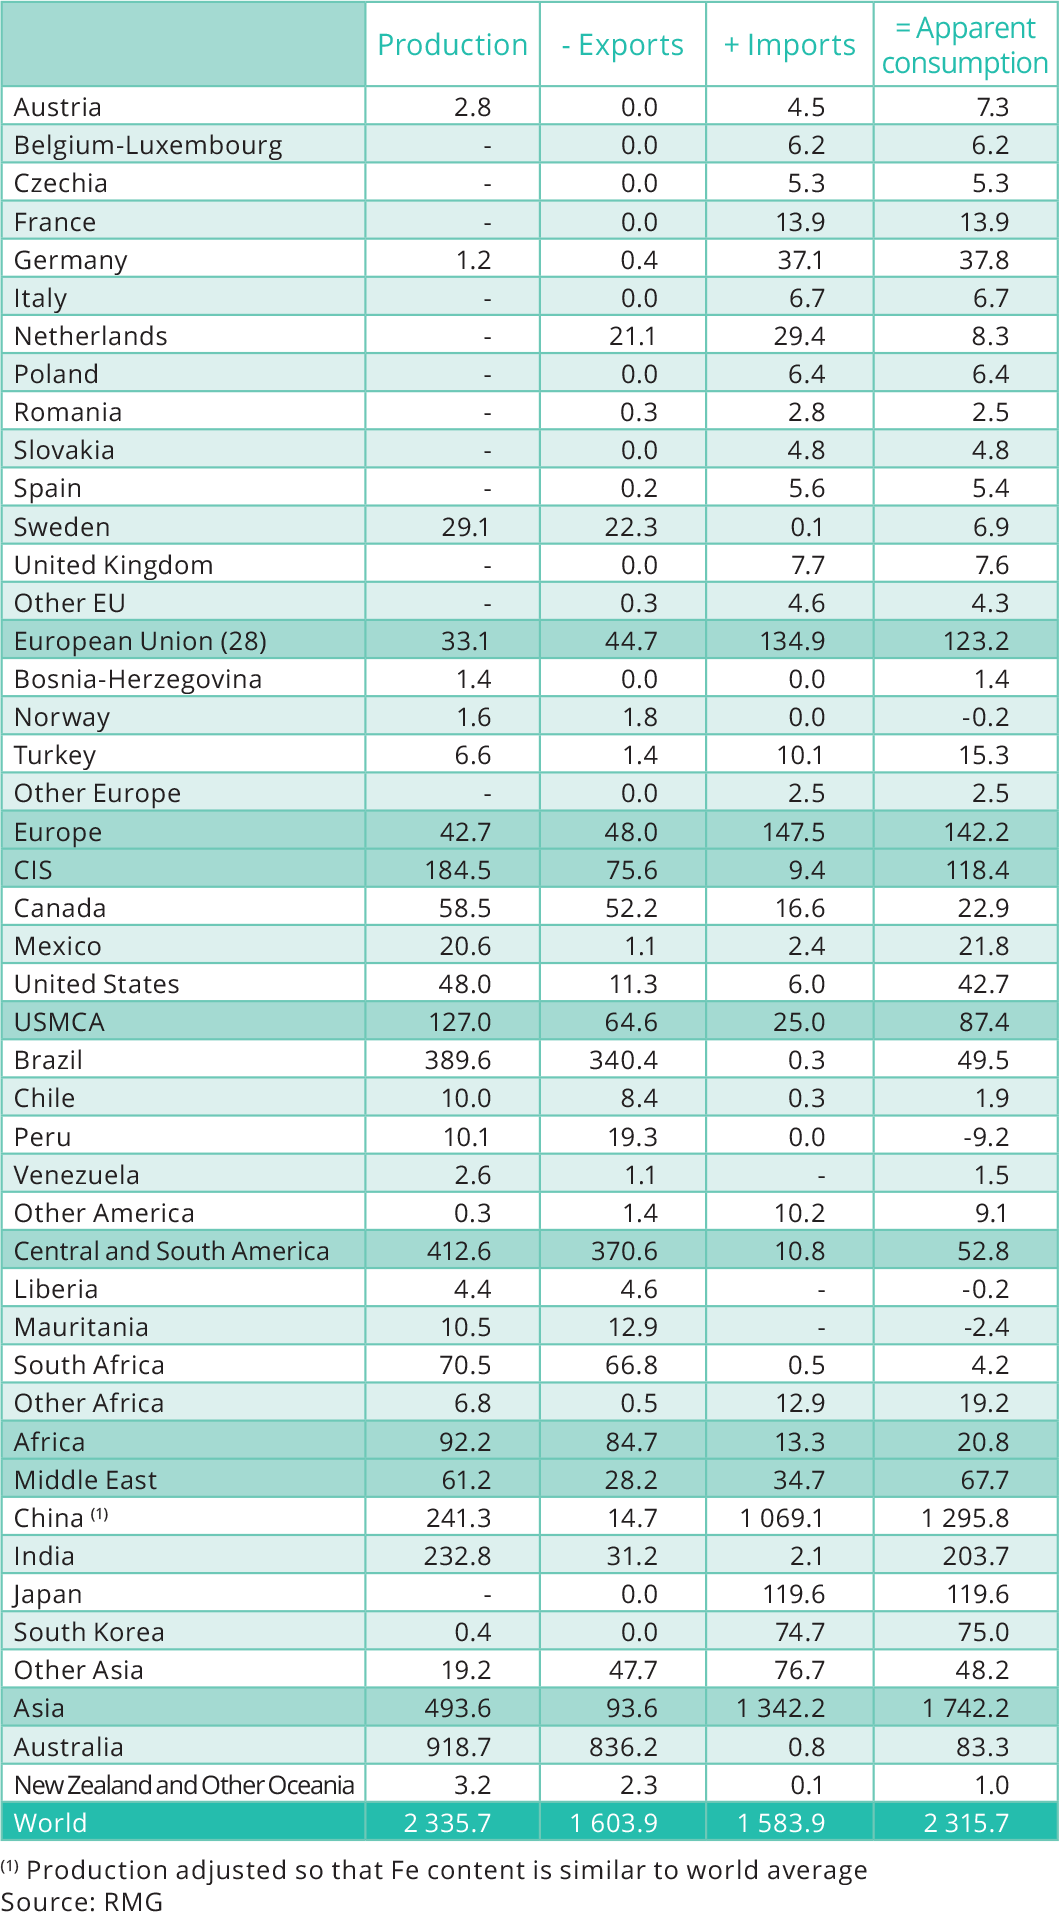
World trade in iron ore by area, 2020
million tonnes
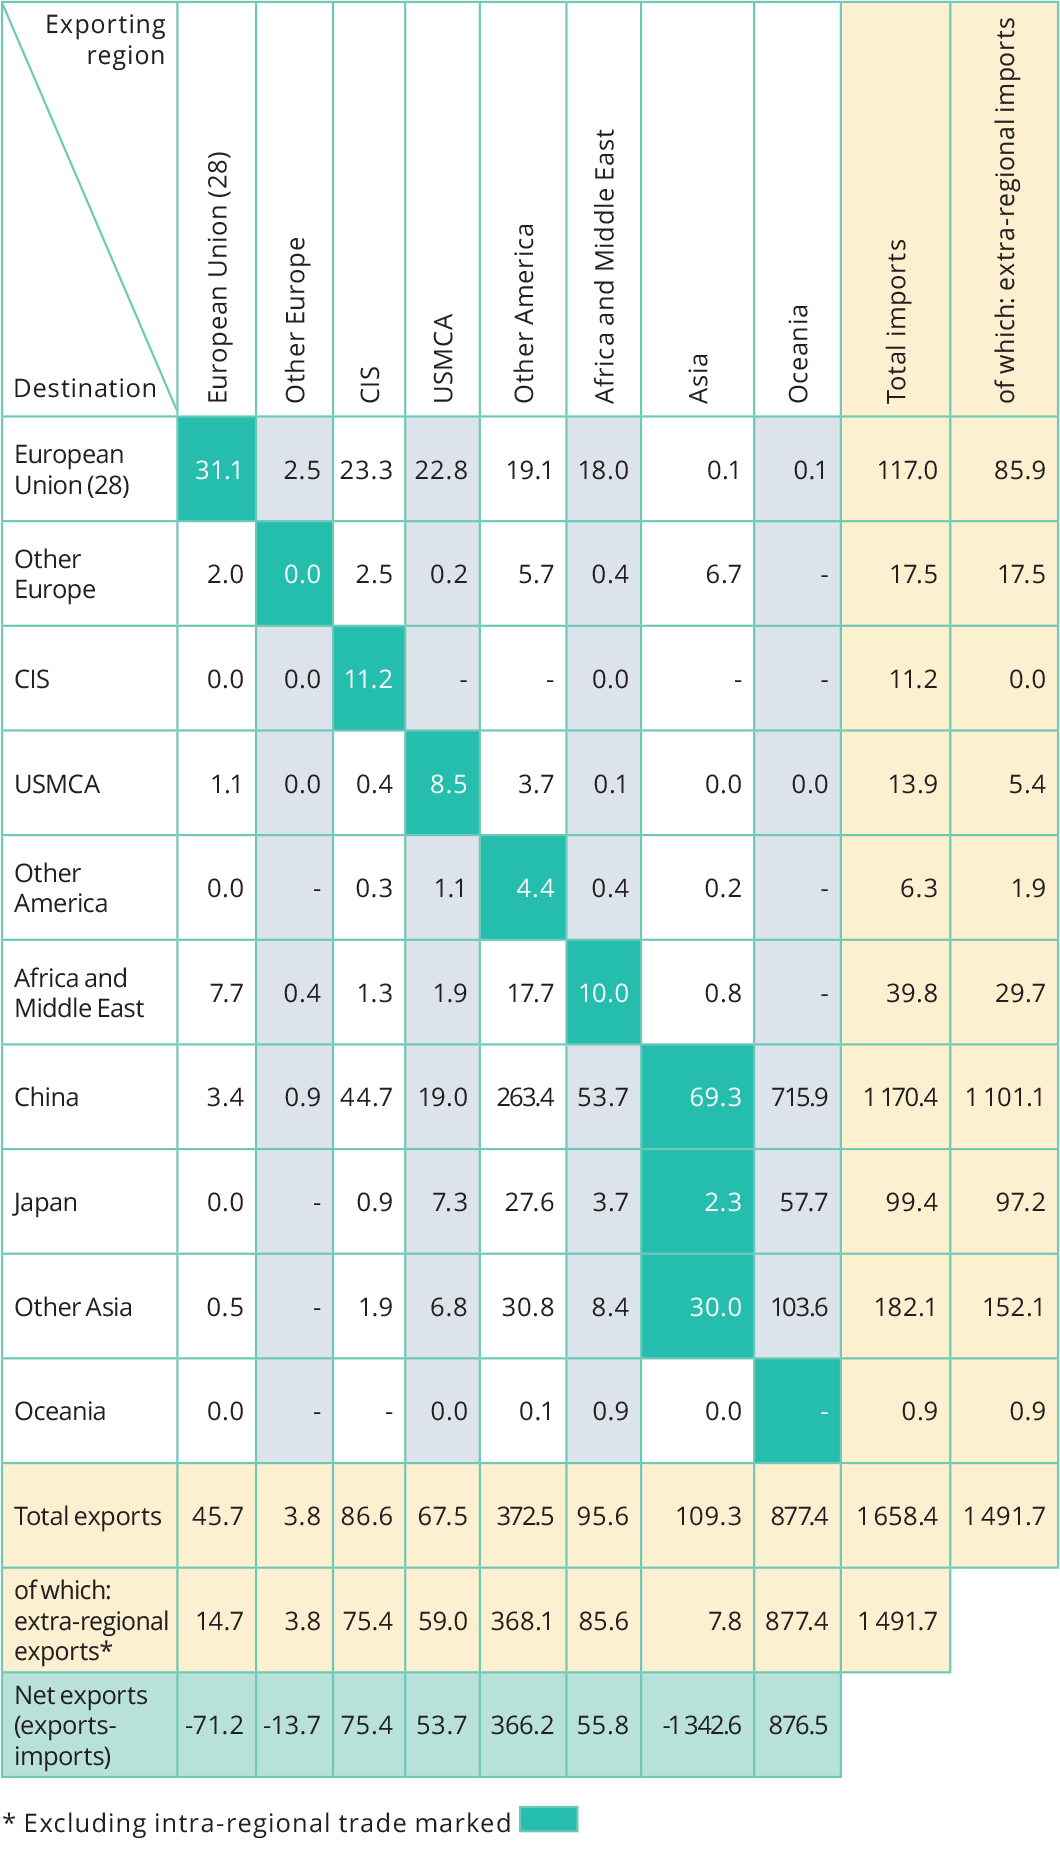
Trade in ferrous scrap 2019 and 2020
million tonnes
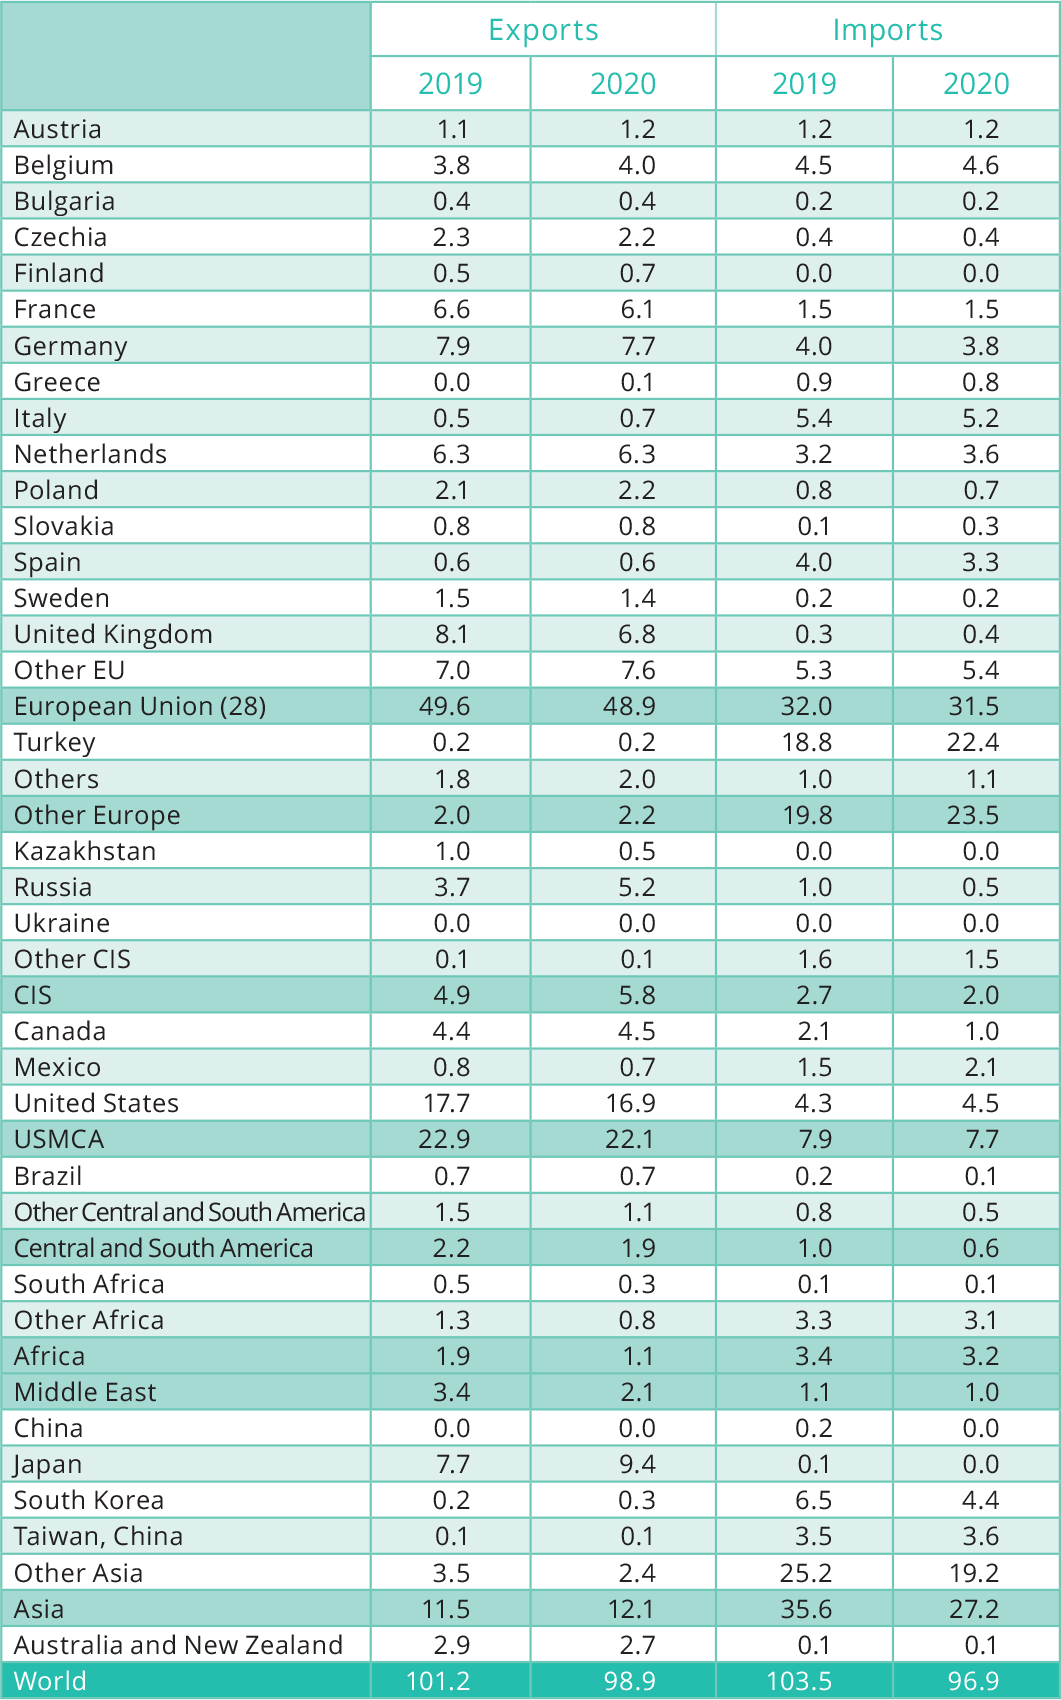
World trade in ferrous scrap by area, 2020
million tonnes
World steel trade in products 1975 to 2020
million tonnes
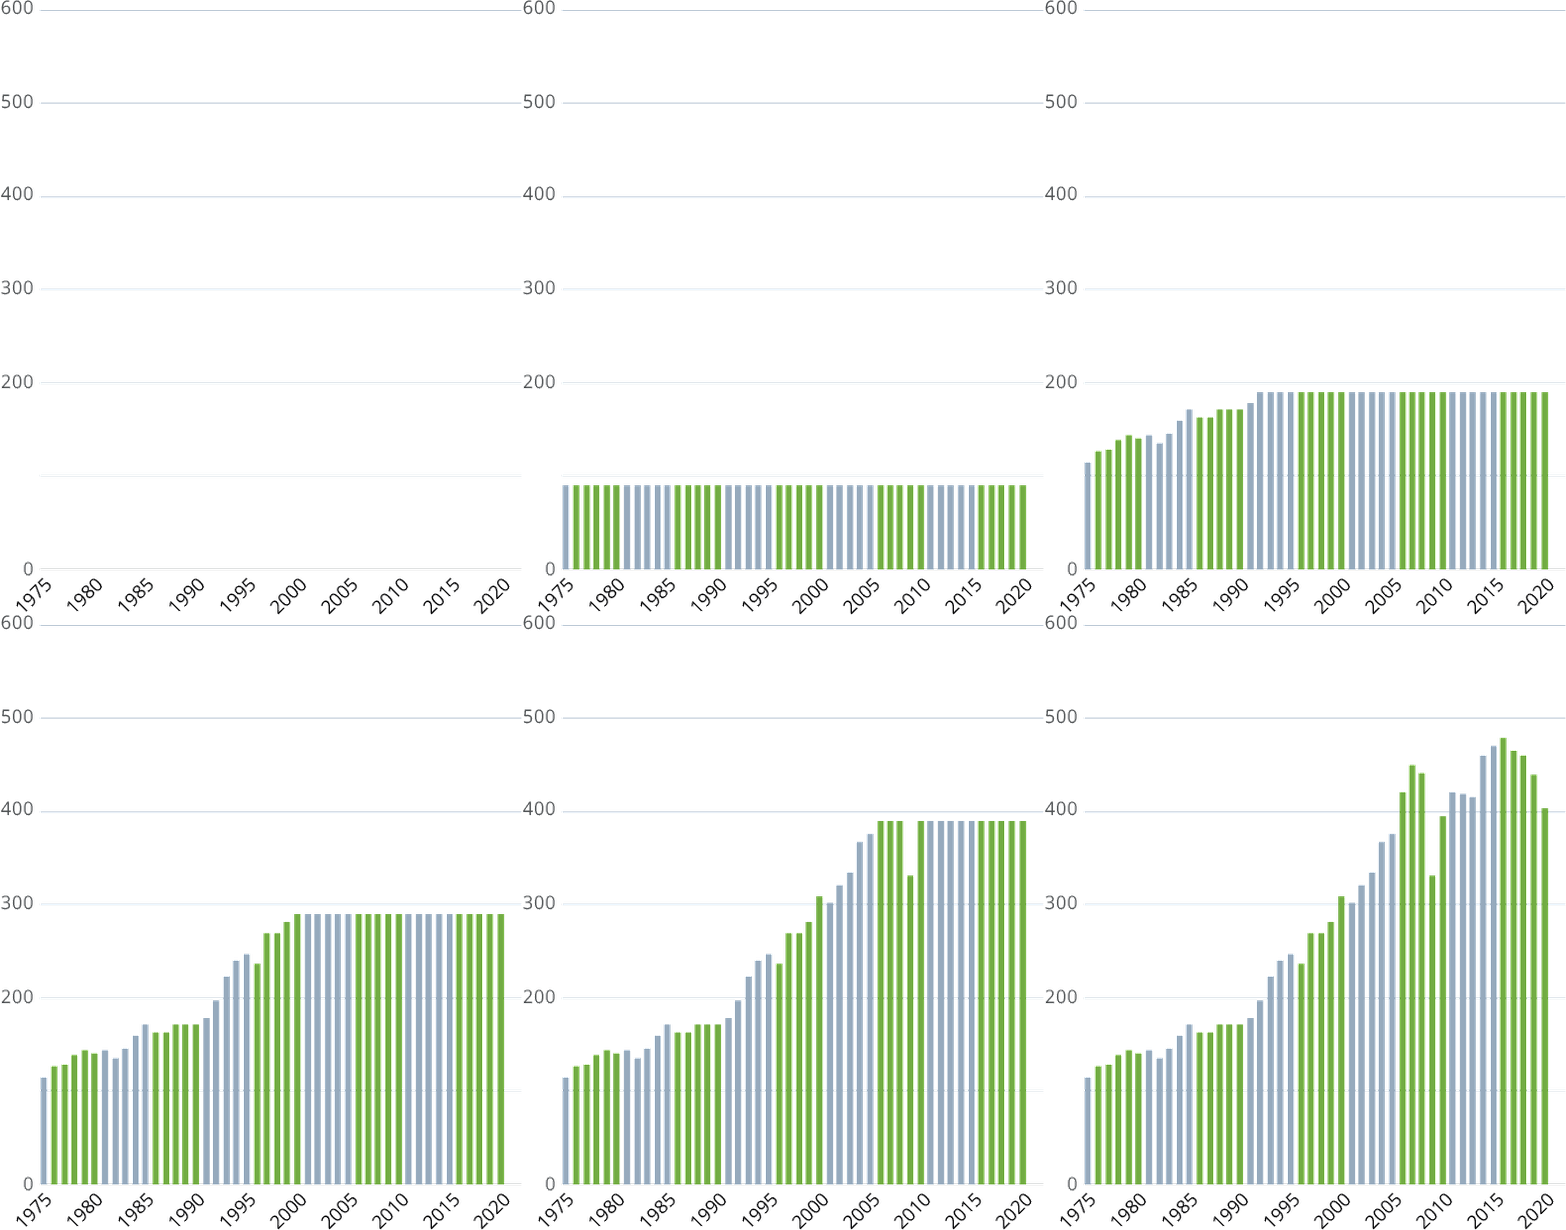
Exports are of finished and semi-finished steel products. Production of finished steel, where not available from national sources, is calculated from crude steel production taking into account the continuous casting ratio. |
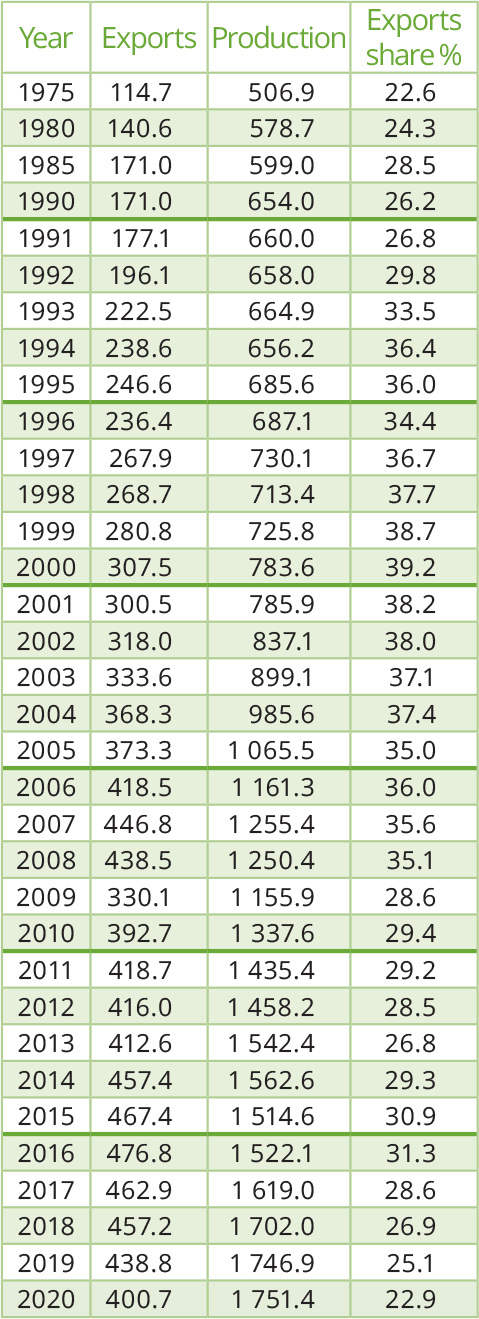 |
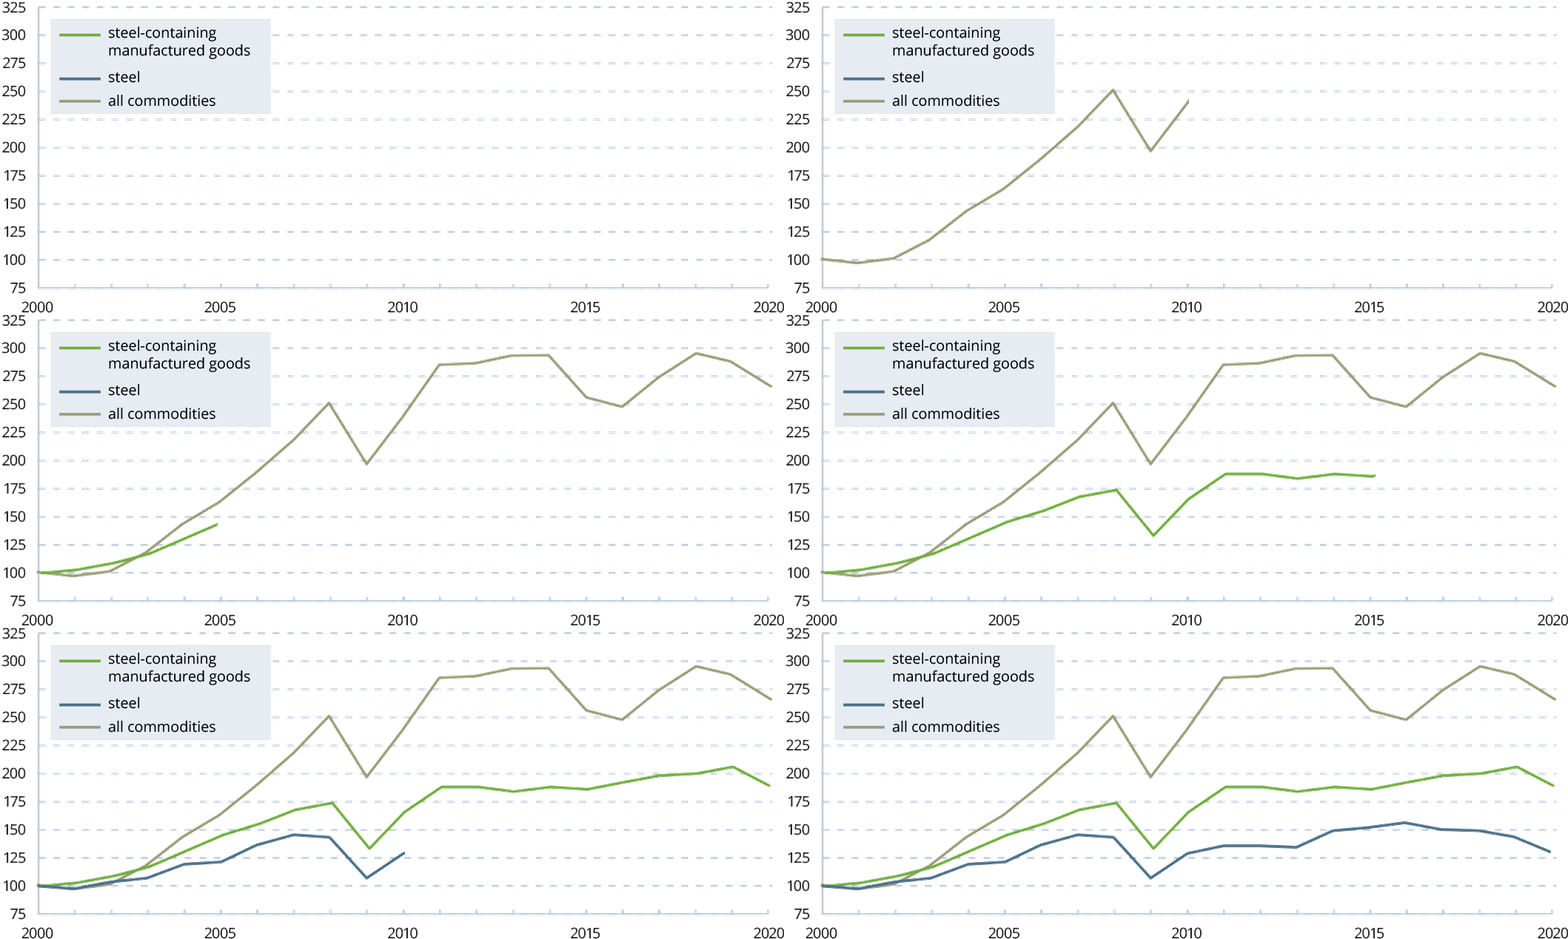
World volume of trade 2000 to 2020
Quantum indices 2000 = 100
World steel exports by product 2016 to 2020
million tonnes
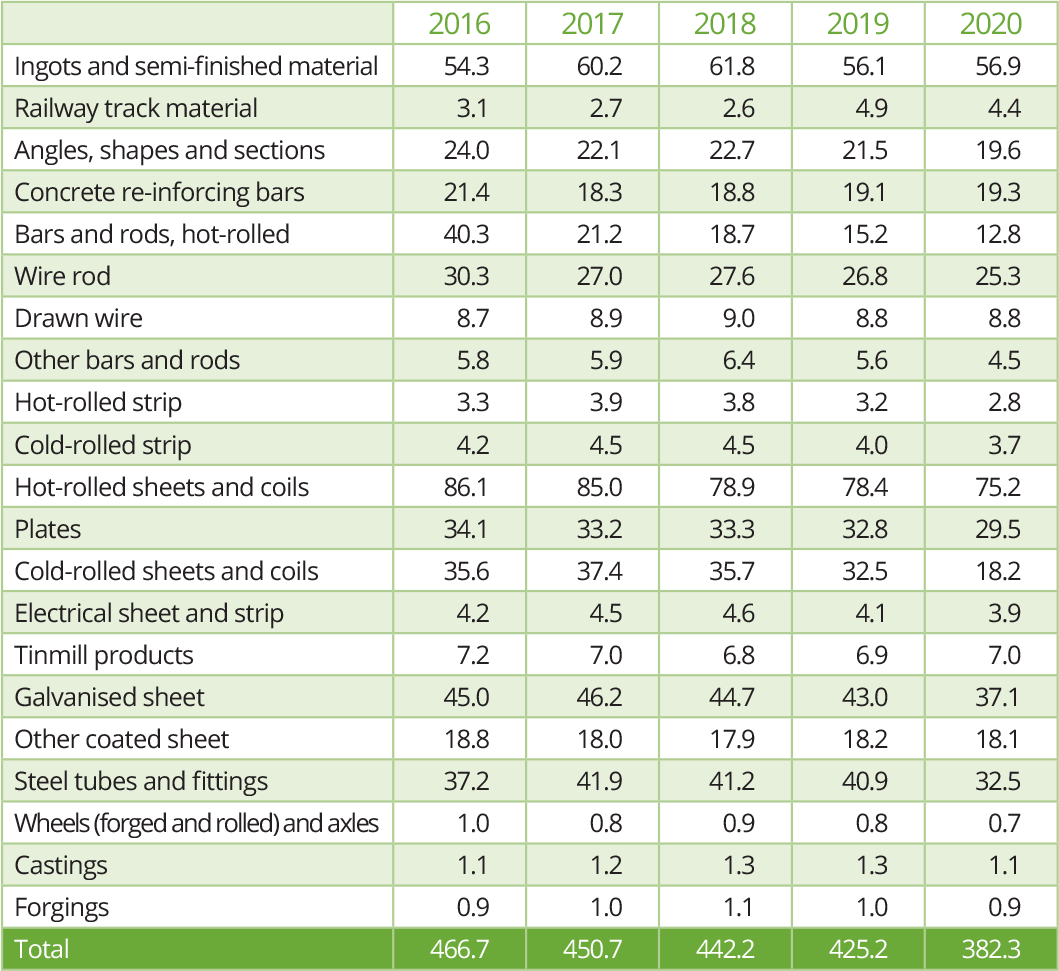
Exports include intra-EU trade, trade between countries of the CIS, and trade between USMCA countries. The figures are based on a broad definition of the steel industry and its products, including ingots, semi-finished products, hot-rolled and cold-finished products, tubes, wire, and unworked castings and forgings. The above table comprises the exports of 62 countries, which represents approximately 96.1 per cent of total world trade in 2020.
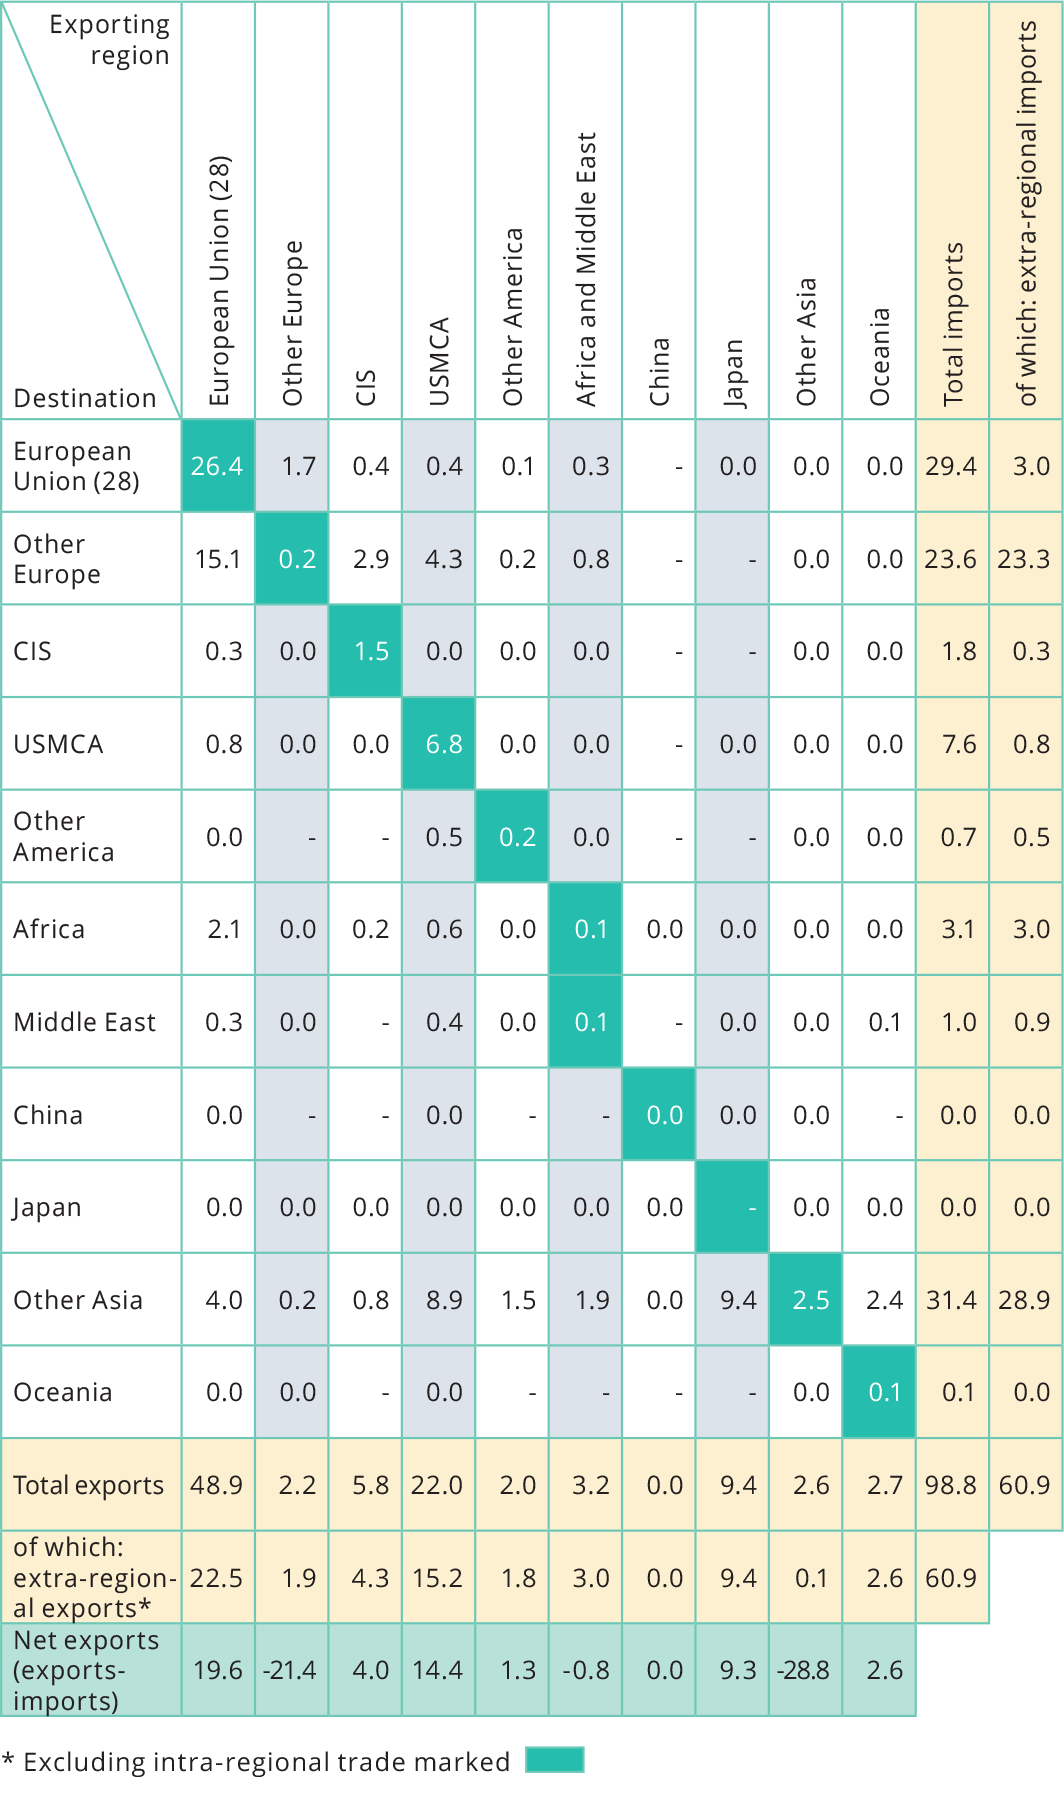
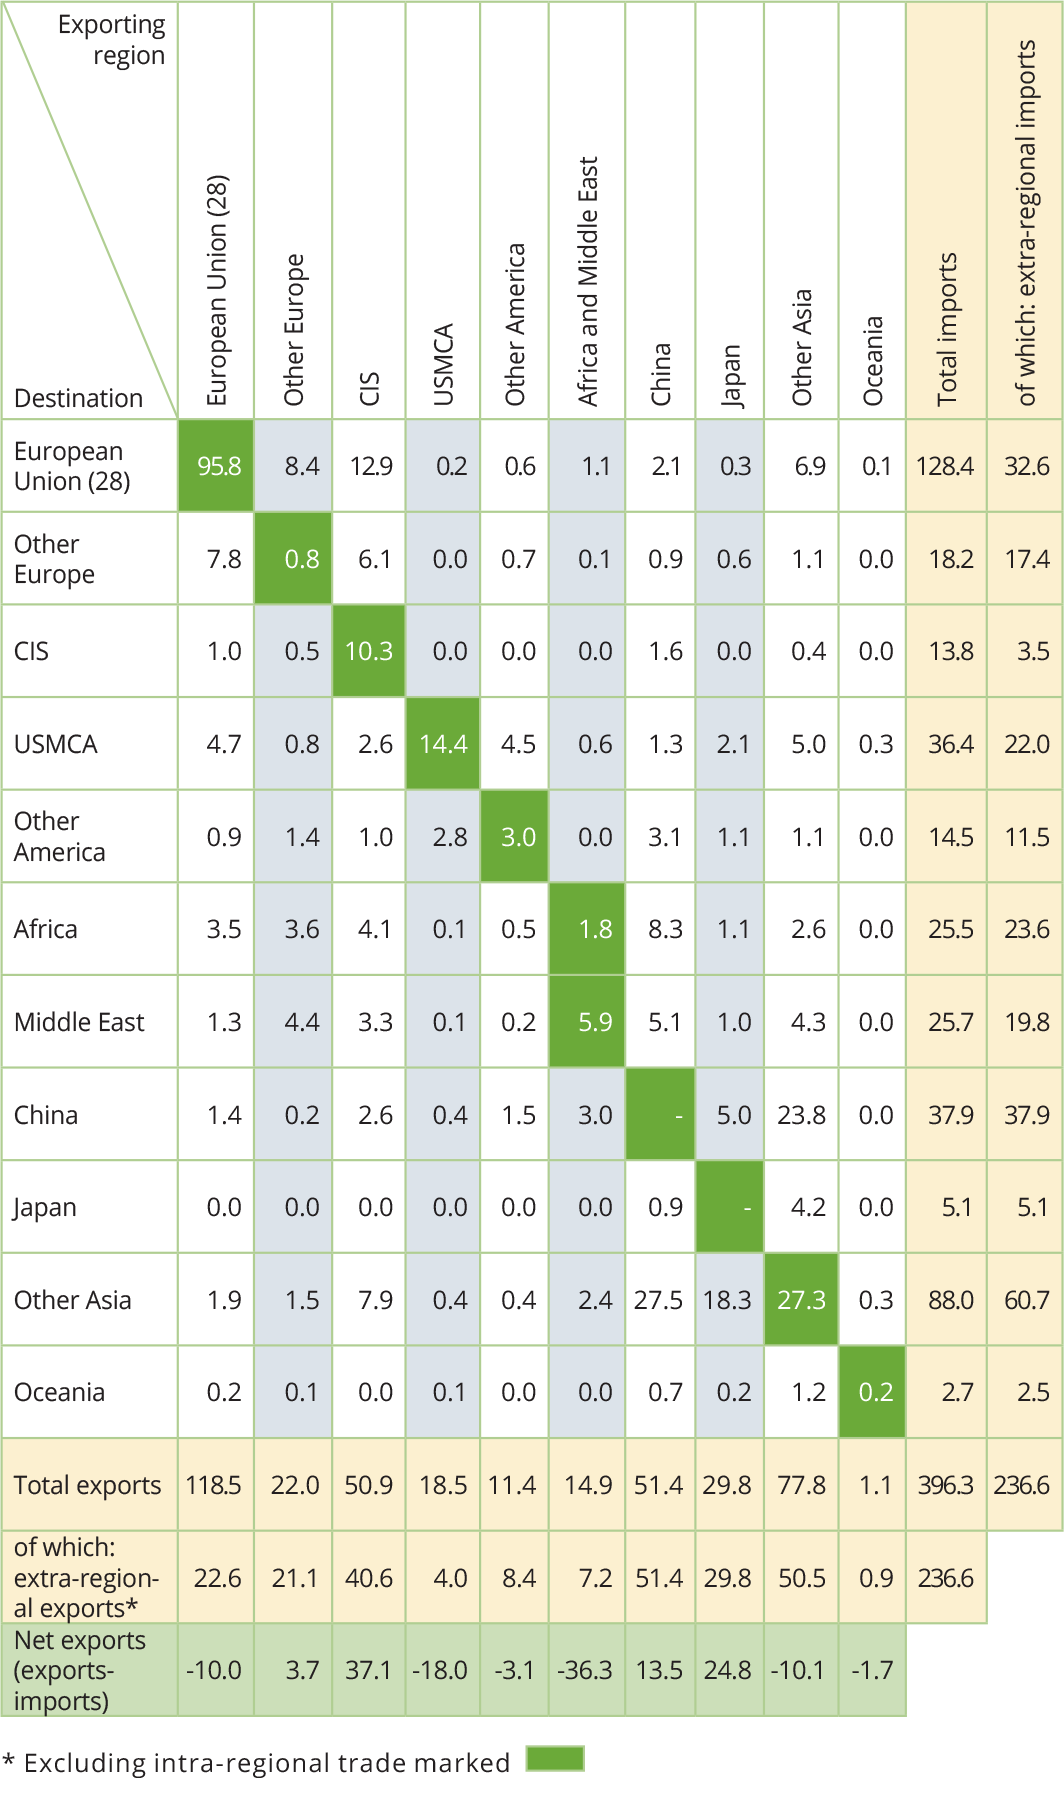
World trade in steel by area 2020
million tonnes
Major importers and exporters of steel 2020
million tonnes
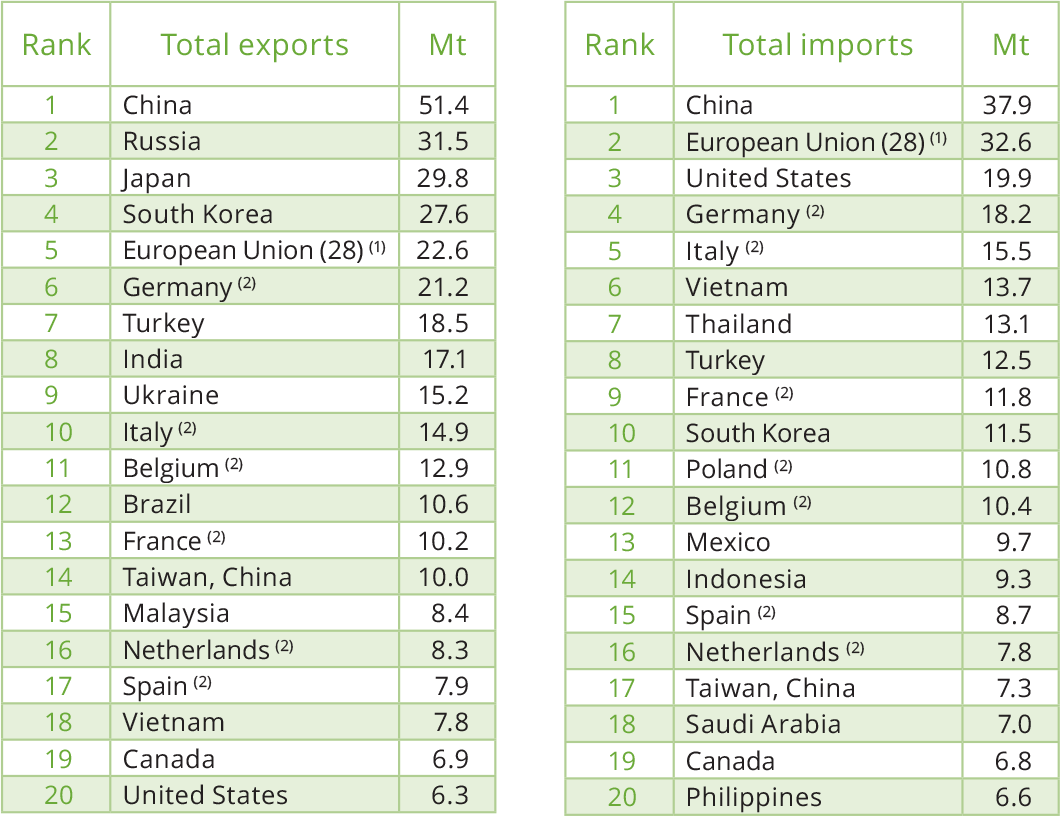
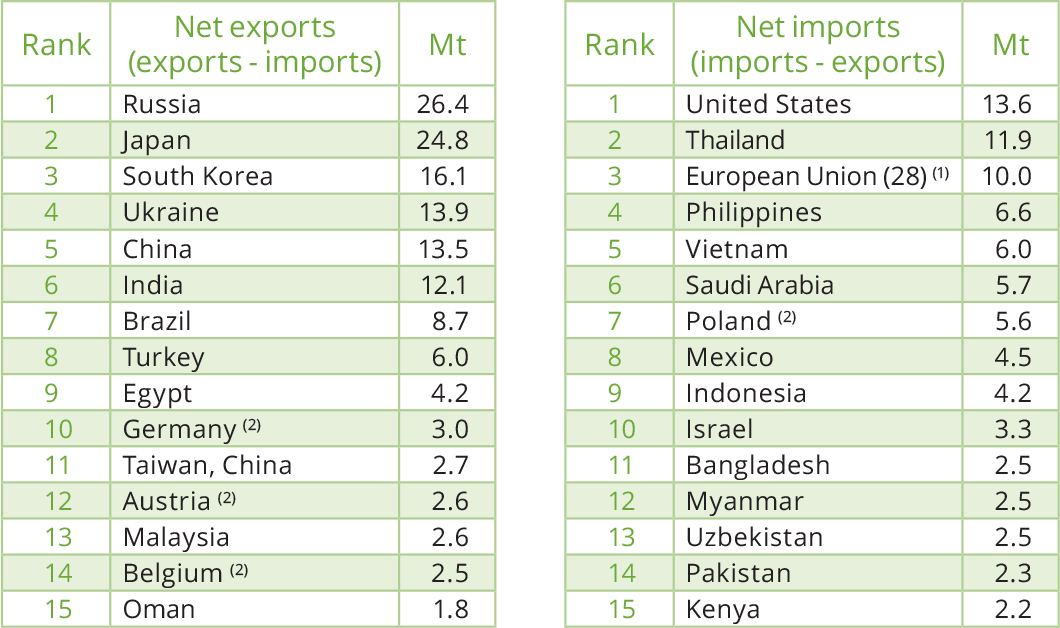
(1) Excluding intra-regional trade
(2) Data for individual European Union (28) countries include intra-European trade
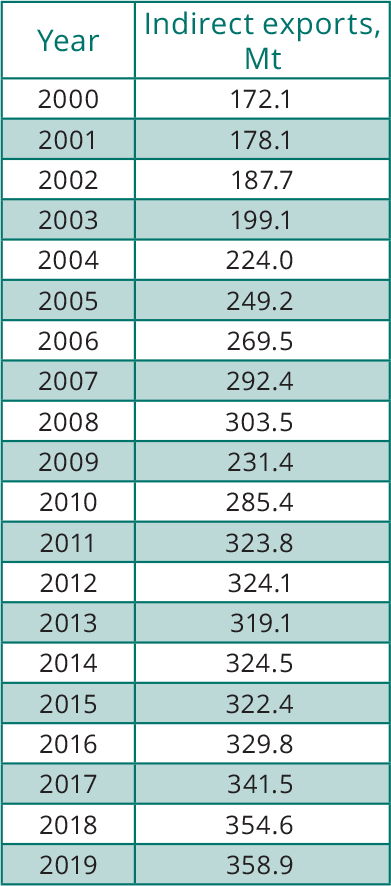
Indirect trade in steel 2000 to 2019
million tonnes, finished steel equivalent
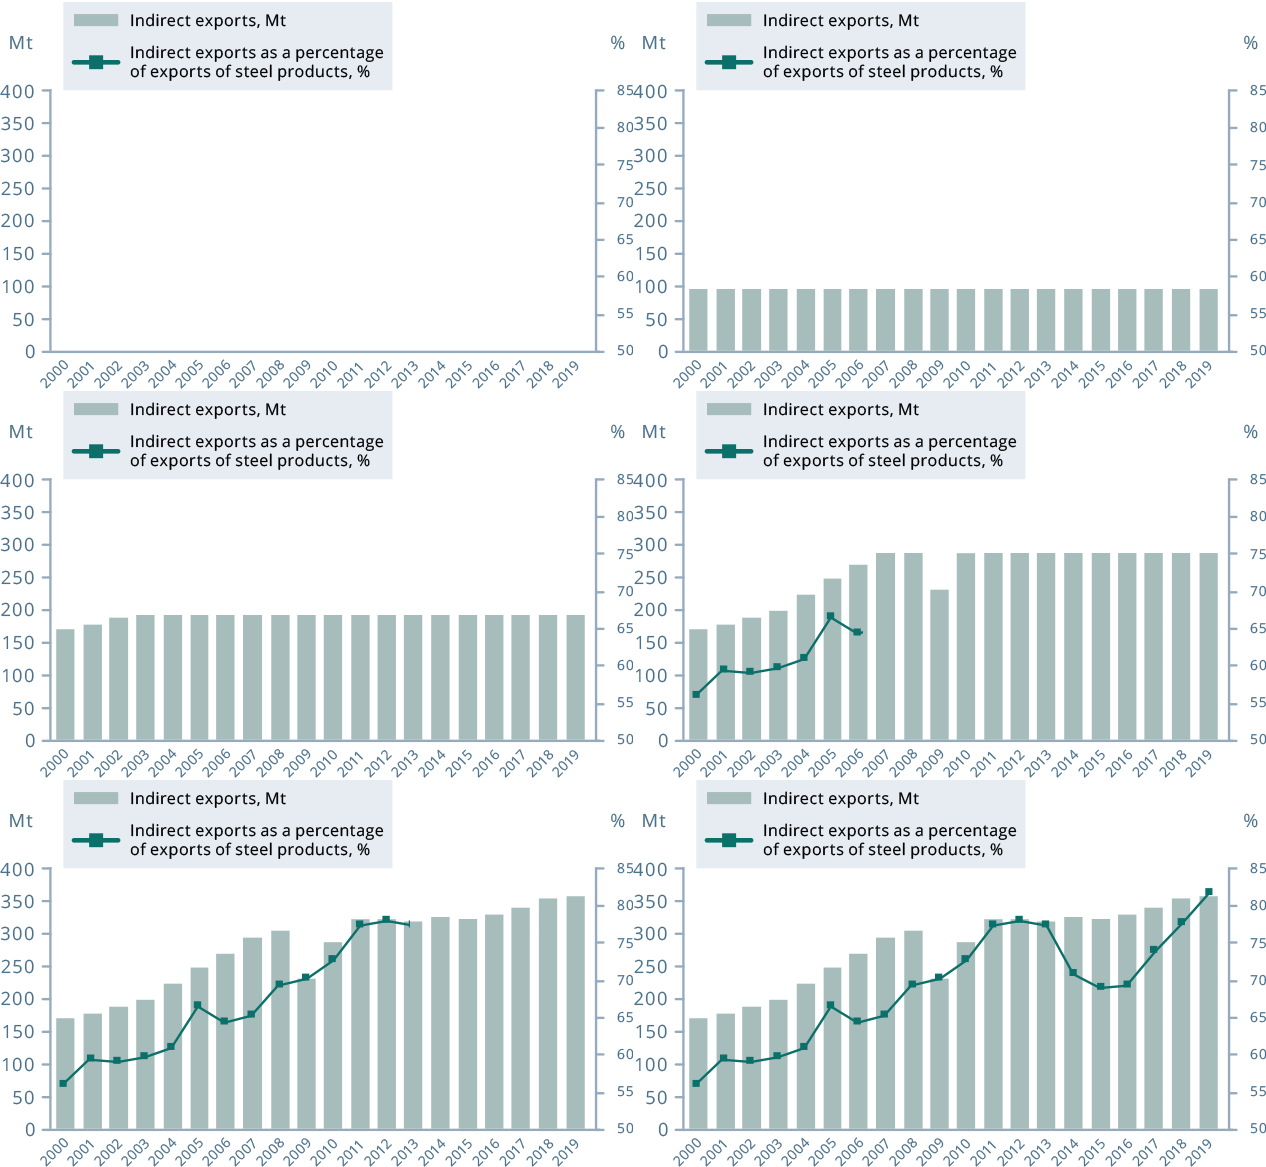
Indirect trade in steel takes place through
|
 |
True steel use 2015 to 2019
million tonnes, finished steel equivalent
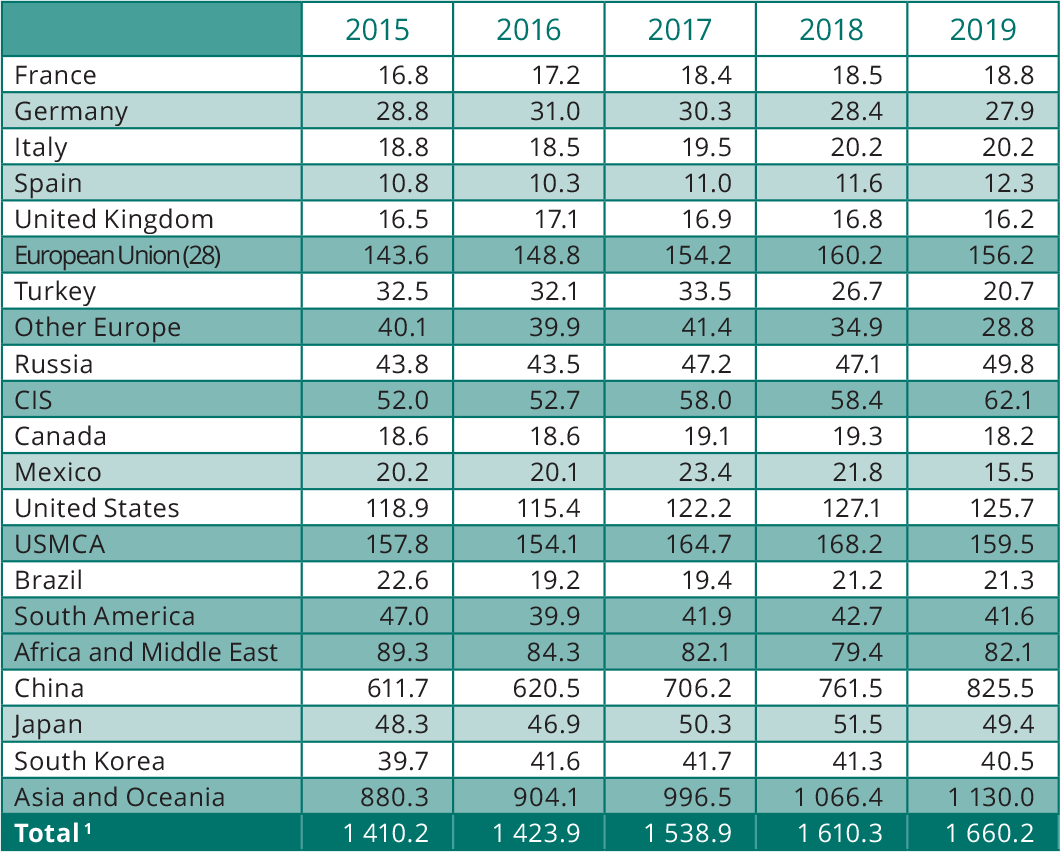
(1) Total comprises 74 countries
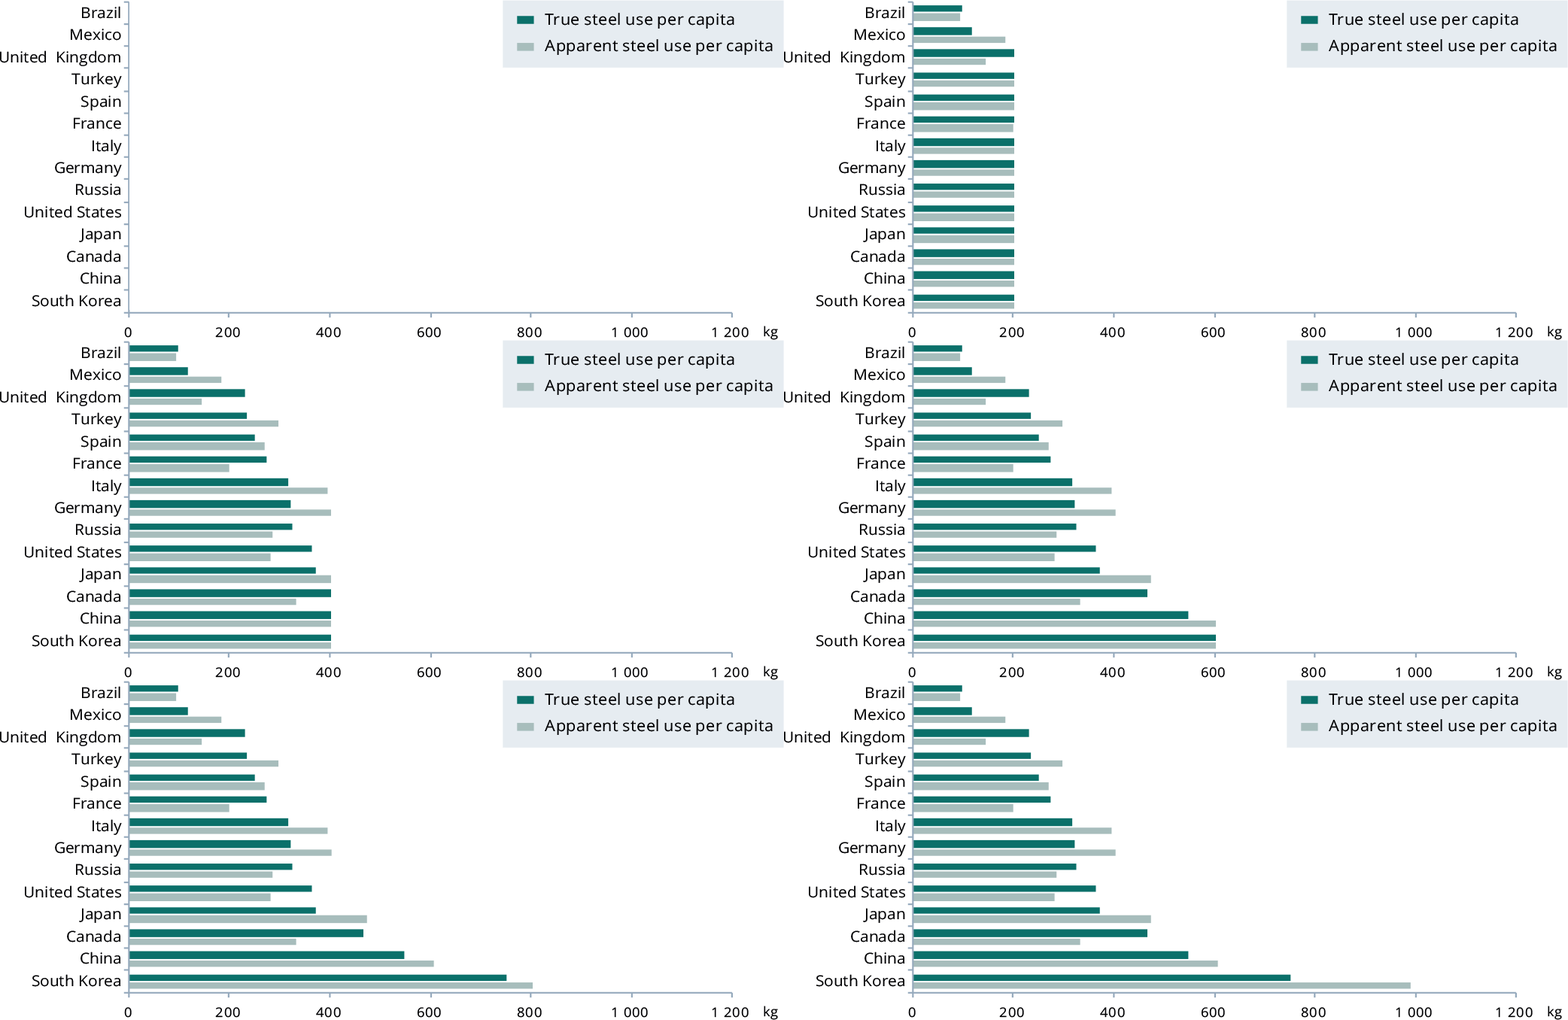
True steel use (TSU) is obtained by subtracting net indirect exports of steel from apparent steel use (ASU). Total TSU is not equal to ASU because of differences in country coverage and methodological specifics of indirect trade in steel calculations. Further details can be found at worldsteel.org/publications/reports.
Major indirect importers and exporters of steel 2019
million tonnes, finished steel equivalent
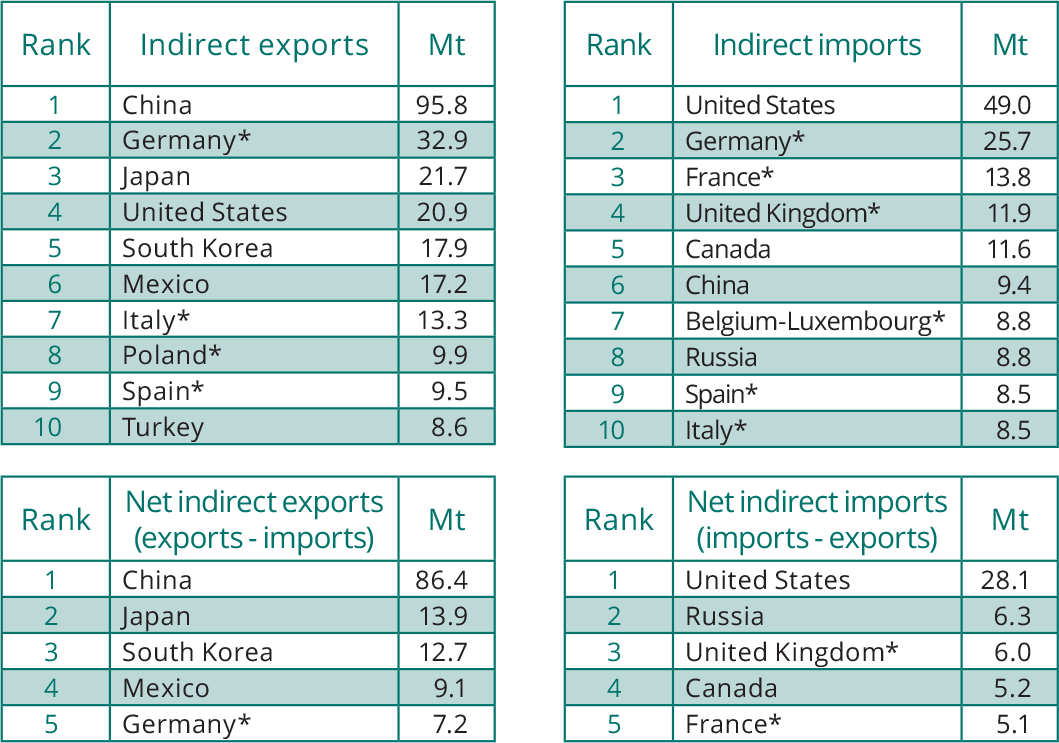
*Data for individual European Union (28) countries include intra-European trade
Apparent and true steel use per capita, 2019
kilograms, finished steel equivalent
About us
Notation used in this publication:
| (e) | indicates a figure that has been estimated. |
| 0.0 | indicates that the quantity concerned is less than 0.05. |
| – | indicates zero or no data. |


