Foreword

Dr Edwin Basson – Director General

We recently issued our April Short Range Outlook in the shadow of the human and economic tragedy taking place in Ukraine; we hope peace will return as soon as possible. The magnitude of the impact of this conflict will vary across regions, depending on their direct trade and financial exposure to Russia and Ukraine. However, we have forecasted that steel demand will grow by 0.4% in 2022 to reach 1840.2 Mt. In 2023, steel demand will see further growth of 2.2% to reach 1 881.4 Mt.

Safety remains our top priority. Each year since 2014, on International Steel Safety Day, we launch a major global campaign to reinforce awareness of the five most common causes of safety incidents. This year we are focusing on the dangers of working from heights and the campaign includes online training webinars, training publications and safety tips.

This year we launched our revised and expanded Sustainability Charter. The new Charter is organised into 9 principles and 20 required criteria reflecting the industry’s increasing focus on sustainability and its responsibility to generate positive impacts on people, our planet, and the prosperity of society. Thirty-nine members have provided the evidence that they are aligned with these criteria and are therefore recognised as Charter Members for a 3-year period. I congratulate them all.

World Steel in Figures provides a handy, summarised picture of the global steel industry today. I hope you find this valuable and thought-provoking. If you have any questions, please contact us at worldsteel.org.

Sustainability Principles and Charter

Our revised and expanded Sustainability Principles reflect the steel industry’s increasing focus on sustainability and its responsibility to take a holistic approach through actively addressing environmental, social, economic and corporate concerns.

The Charter covers:

4 areas

9 topics


9 principles

20 criteria

Our revised and expanded Sustainability Principles strongly encourage worldsteel member organisations to be proactively engaged in our sustainability programmes and to push for higher standards in their sustainability commitment and performance. To be eligible to sign the Charter, organisations need to meet 20 criteria.

Sustainability Charter: 9 principles and 20 criteria

9 principles 20 criteria
Proactively address climate change and take effective actions to minimise the industry’s GHG emissions. CO2 and energy
CO2 reduction plans and goals
Maximise the efficient use of resources throughout the life cycle of steel products and support society to achieve a circular economy. LCI data
Waste and
co-products
Conduct operations in an environmentally responsible manner. Environmental improvement
Air and water emissions
Environmental management
systems
Maintain a safe and healthy workplace and act on health and safety incidents, risks and opportunities. Safety data
Safety management system
Safety performance
Steel Safety Day
Enable our people to realise their potential while providing them with an inclusive and fair working environment. Employee training
Management policies
Build trust and create constructive relationships with local communities. Community engagement or investment
Lead responsible business practices through the value chain. Responsible value chains. Supply chain
Conduct operations with high standards and transparent processes. Business conduct
Sustainability reporting
Stakeholder engagement
Pursue innovations for technologies and products to achieve sustainable economic development. Investment
Economic Value Distributed

Programmes associated with the sustainability criteria

The worldsteel programmes associated with the Sustainability Charter are listed below:

Sustainability Indicators data collection

Data is collected from our members and reported annually for 8 Sustainability Indicators, systematically measuring and reporting key aspects of the steel industry’s economic, environmental and social performance. This programme provides member companies with benchmarking opportunities and scope for improvement.
The 8 indicators are:

  • CO2 emissions intensity
  • Energy intensity
  • Material efficiency
  • Environmental management systems
  • Lost Time Injury Frequency Rate
  • Employee training
  • Investment in new processes and products
  • Economic Value Distributed


Life cycle inventory data collection

A life cycle assessment (LCA) of a steel product looks at resources, energy and emissions, from the steel production stage to its end-of-life stage, including recycling. worldsteel collects data for the production of 17 steel products and generates product specific life cycle inventories available to all stakeholders worldwide.


Steel Safety Day

28 April is Steel Safety Day. The initiative aims to reinforce awareness and ensure the presence of controls for high-risk activities in the steel industry. Every year worldsteel launches a global campaign centred on a theme which involves one of the main causes of fatalities in the industry.


For more information on the worldsteel Sustainability Programme and the organisations that signed the Sustainability Charter, visit the sustainability section of worldsteel.org.

World crude steel production 1950 to 2021

million tonnes, crude steel production

million tonnes, crude steel production

Top steel-producing companies 2021

million tonnes, crude steel production

  1. Includes tonnage of Taiyuan Steel and Kunming Steel
  2. Includes 60% AM/NS India (former Essar Steel)
  3. Includes tonnage of Benxi Steel
  4. Includes Nippon Steel Stainless Steel Corporation, Sanyo Special Steel, Ovako, 40% AM/NS India and 31.4% USIMINAS
  5. Estimated combined tonnage of Mobarrakeh Steel, Esfahan Steel, Khuzestan Steel and NISCO
  6. Includes Big River Steel
  7. Include AK Steel and former ArcelorMittal USA operations

Notes on company ownership and tonnage calculations:
For worldsteel members, the data was sourced from their official tonnage declarations. For Chinese companies, the official CISA tonnage publication was used, unless especially noted. In case of more than 50% ownership, 100% of the subsidiary’s tonnage is included, unless specified otherwise. In cases of 30%-50% ownership, pro-rata tonnage is included. Unless otherwise specified in the declaration, less than 30% ownership is considered a minority and therefore, not included. Figures represent ownership ending 31 December 2021.
For an extended company listing, go to worldsteel.org/steel-by-topic/statistics/top-producers.

Major steel-producing countries 2021 and 2020

million tonnes, crude steel production

Crude steel production by process, 2021

The countries in this table accounted for approximately 99.9% of world crude steel production in 2021.
(e) = estimate

Continuously-cast steel output 2019 to 2021

The countries in this table accounted for approximately 99.9% of world crude steel production in 2021
(e) = estimate

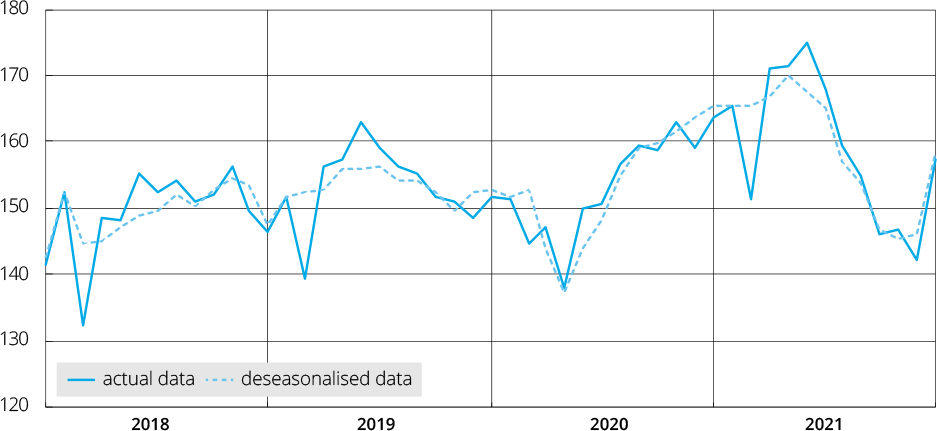
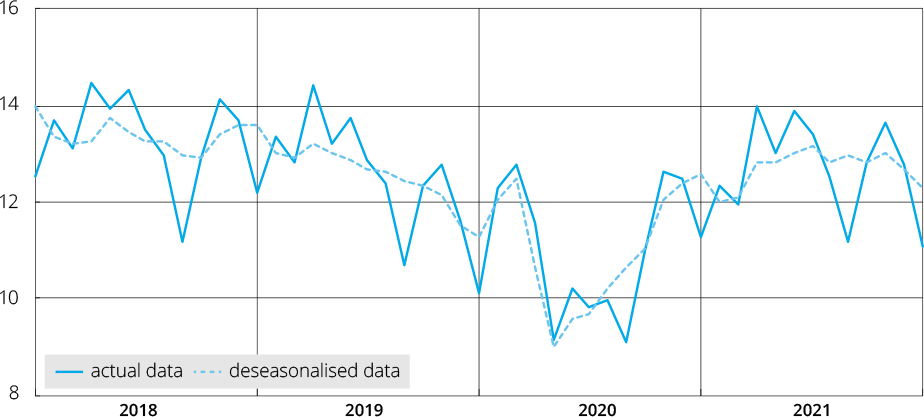
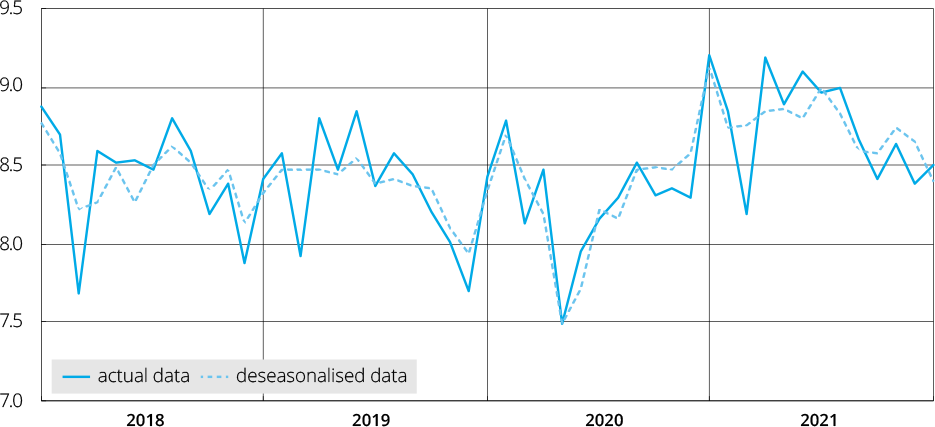
Monthly crude steel production 2018 to 2021

million tonnes

Total 64 reporting countries*
 

European Union (27)
 

Russia and Other CIS (4) + Ukraine
 

*The 64 reporting countries:

Argentina, Australia, Austria, Belgium, Bosnia-Herzegovina, Brazil, Bulgaria, Belarus, Canada, Chile, China, Colombia, Croatia, Cuba, Czechia, Ecuador, Egypt, El Salvador, Finland, France, Germany, Greece, Guatemala, Hungary, India, Iran, Italy, Japan, Kazakhstan, Libya, Luxembourg, Macedonia, Mexico, Moldova, Netherlands, New Zealand, Norway, Pakistan, Paraguay, Peru, Poland, Portugal, Qatar, Romania, Russia, Saudi Arabia, Serbia, Slovakia, Slovenia, South Africa, South Korea, Spain, Sweden, Taiwan, China, Thailand, Turkey, Ukraine, United Arab Emirates, United Kingdom, United States, Uruguay, Uzbekistan, Venezuela, and Vietnam.

In 2021, these 64 countries accounted for approximately 98% of world crude steel production.

million tonnes

USMCA


Central and South America


Japan


China

Steel production and use: geographical distribution 2011

Crude steel production
World total: 1 540 million tonnes

Others comprise:

Africa 1.0% Central and South America 3.2%
Middle East 1.5% Australia and New Zealand 0.5%


Apparent steel use (finished steel products)
World total: 1 419 million tonnes

Others comprise:

Africa 2.1% Central and South America 3.3%
Middle East 3.6% Australia and New Zealand 0.5%


Steel production and use: geographical distribution 2021

Crude steel production
World total: 1 951 million tonnes

Others comprise:

Africa 1.0% Central and South America 2.4%
Middle East 2.3% Australia and New Zealand 0.3%


Apparent steel use (finished steel products)
World total: 1 834 million tonnes

Others comprise:

Africa 2.0% Central and South America 2.8%
Middle East 2.6% Australia and New Zealand 0.4%


Apparent steel use 2017 to 2021

million tonnes, finished steel products

(e) = estimate

Apparent steel use per capita 2017 to 2021

kilograms, finished steel products

Pig iron 2020 and 2021

million tonnes

(e) = estimate

Direct reduced iron production 2017 to 2021

million tonnes

(e) = estimate

Iron ore 2020

million tonnes, actual weight

(1) Production adjusted so that Fe content is similar to world average. Source: RMG.

World trade in iron ore by area, 2021

million tonnes

* Excluding intra-regional trade marked      

Trade in ferrous scrap 2020 and 2021

million tonnes

World trade in ferrous scrap by area, 2021

million tonnes

* Excluding intra-regional trade marked      

World steel trade in products 1975 to 2021

million tonnes


Exports are of finished and semi-finished steel products. Production of finished steel, where not available from national sources, is calculated from crude steel production, taking into account the continuous casting ratio.


World volume of trade 2000 to 2021

Quantum indices 2000 = 100

World steel exports by product 2017 to 2021

million tonnes

Exports include intra-EU trade, trade between countries of the CIS, and trade between USMCA countries. The figures are based on a broad definition of the steel industry and its products, including ingots, semi-finished products, hot-rolled and cold-finished products, tubes, wire, and unworked castings and forgings. The above table comprises the exports of 62 countries, which represents approximately 94.8 per cent of total world trade in 2021.

World trade in steel by area 2021

million tonnes

* Excluding intra-regional trade marked      

Major importers and exporters of steel 2021

million tonnes

(1) Excluding intra-regional trade
(2) Data for individual European Union (27) countries include intra-European trade

Indirect trade in steel 2000 to 2019

million tonnes, finished steel equivalent


An explanation of the methodology of indirect trade in steel can be found in the report ‘Indirect Trade in Steel (March 2015)’ at worldsteel.org/publications/reports.

True steel use 2015 to 2019

million tonnes, finished steel equivalent

(1) The total comprises 74 countries.

Major indirect importers and exporters of steel 2019

million tonnes, finished steel equivalent

*Data for individual European Union (27) countries include intra-European trade

Apparent and true steel use per capita, 2019

kilograms, finished steel equivalent

About us

The World Steel Association (worldsteel) is one of the largest and most dynamic industry associations in the world, with members in every major steel-producing country.

worldsteel represents steel producers, national and regional steel industry associations, and steel research institutes. Members represent around 85% of global steel production.

worldsteel’s mission is to promote the steel industry and steel as a material, find global solutions to the environmental challenge, identify and analyse important megatrends, and encourage alignment between regional and national steel associations.

More information

In addition to this World Steel in Figures publication, worldsteel releases data on a monthly and annual basis. A selection of this data is available for free at https://worldsteel.org/steel-by-topic/statistics/.

A more comprehensive selection of data can be purchased through our bookshop at https://worldsteel.org/publications/bookshop/.
For more details contact subscribers@worldsteel.org.

Notation used in this publication:

(e) indicates a figure that has been estimated.
0.0 indicates that the quantity concerned is less than 0.05.
indicates zero or no data.